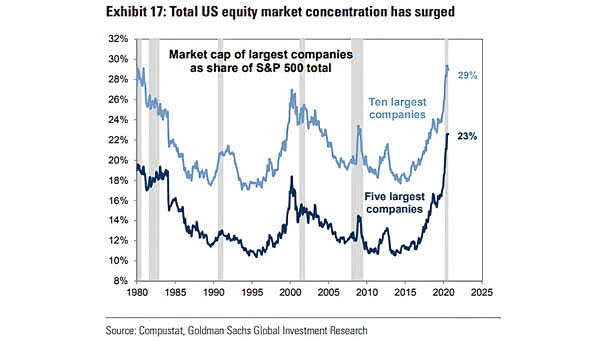
S&P 500 Futures Market Liquidity

S&P 500 Futures Market Liquidity Liquidity in U.S. equity collapsed in early 2018 and remains at low levels. Lack of liquidity tends to lead to violent market moves. Image: Goldman Sachs Global Investment Research

S&P 500 Index and Total Return to Gold Ratio

S&P 500 Index and Total Return to Gold Ratio According to BofA, the gold to equity ratio is elevated given the earnings uncertainty, but it is far from historical highs. Image: BofA Global Research

U.S. Fund Flows Cumulative Since 2018

U.S. Fund Flows Cumulative Since 2018 Fear of a recession has led to a record equity outflows and bond & cash inflows in recent years. Image: Goldman Sachs Global Investment Research

S&P 500 Valuation Metric

S&P 500 Valuation Metric Is the U.S. equity market overvalued? The S&P 500’s median valuation metric is in the 89th percentile. That’s not cheap by historical standards. Image: Goldman Sachs Global Investment Research

BofA Sell Side Indicator

BofA Sell Side Indicator The BofA’s Sell Side Indicator suggests no euphoria and equity returns of 12% over the next 12 months, putting the S&P 500 at 3,629 by year-end. Image: BofA Global Research US Equity & Quant Strategy

Momentum to Value Rotation

Momentum to Value Rotation The rotation into value suggests a rebound in global economic growth, not a recession. Image: BofA Merrill Lynch US Equity & US Quant Strategy

Debt Securities Issued by S&P 500 Companies

Debt Securities Issued by S&P 500 Companies Should investors be concerned about the corporate debt maturity wall? This chart shows the long term S&P 500 debt maturity schedule. Image: J.P. Morgan US Equity Strategy & Global Quantitative Research