BofA Private Client Sentiment
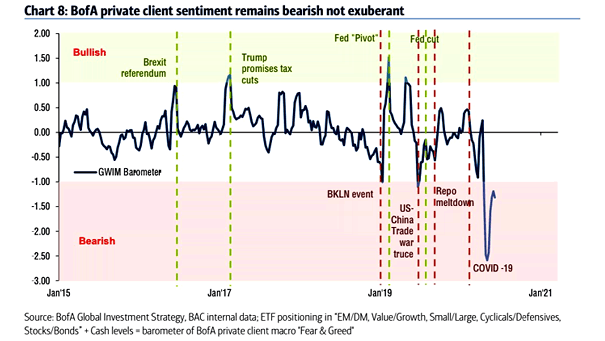
BofA Private Client Sentiment As the chart suggests, BofA private client sentiment is far from exuberant and remains bearish. Image: BofA Global Investment Strategy
BofA Private Client Sentiment As the chart suggests, BofA private client sentiment is far from exuberant and remains bearish. Image: BofA Global Investment Strategy
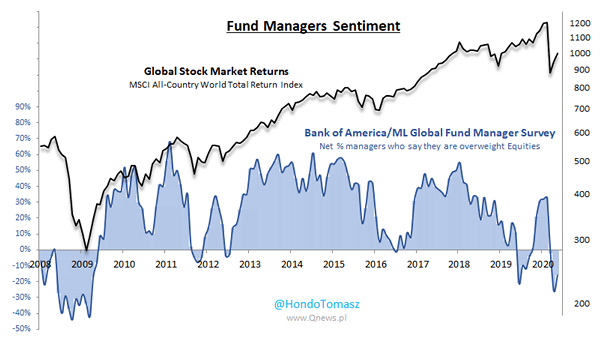
Fund Managers Sentiment and Global Stock Market Returns (MSCI ACWI) Are fund managers too bearish? Two-thirds of global fund managers say this is a bear market rally. Image: Hondo Tomasz

Asset Allocation: Global Bonds FMS investors are still more bearish than bullish. Image: BofA Global Fund Manager Survey
Market Sentiment (AAII) Are AAII investors too bearish? The S&P 500 is up 30%, but there are now more bears than at the March lows. Image: Fidelity Investments
Fintwit’s Sentiment for COVID-19 Topics Are you a perma-bull or a perma-bear? Perma-bulls are back on Twitter! Image: Arbor Research & Trading LLC
S&P 500 Comparison to 2000 and 2008 This chart shows the most recent stock market crash compared to the bear markets of 2000 and 2008. Image: Nautilus Research
S&P 500 vs. AAII Sentiment Survey AAII survey is more bearish than in March, as U.S. individual investors remain pessimistic about the rally. Image: Hondo Tomasz
S&P 500 & E-mini – Small Traders Small trader positioning is still bearish, which is historically bullish for the S&P 500. Image: Renaissance Macro Research
U.S. Conference Board Consumer Confidence Index vs. S&P 500 The U.S. Conference Board Consumer Confidence Index is still high compared to previous bear market bottoms. Image: Tomasz Hońdo
Market Sentiment Index The market sentiment index is at a bearish extreme, but the stock market can still decline further. Image: Alpine Macro
S&P 500 Largest One Day Gains 1928 – 2020 The largest daily gains in the S&P 500 tend to occur during secular bear markets. Image: Bespoke Investment Group