U.S. ISM Manufacturing Index vs. U.S. Core CPI (Core Inflation Leading Indicator)

U.S. ISM Manufacturing Index vs. U.S. Core CPI (Core Inflation Leading Indicator) U.S. annual core CPI at 1.3% in February. The U.S. ISM Manufacturing Index tends to lead U.S. Core CPI by 24 months. You may also like “ISM Manufacturing Index vs. S&P 500 Index” and “U.S. Core Inflation Expected Over the Next 21 Months.“…

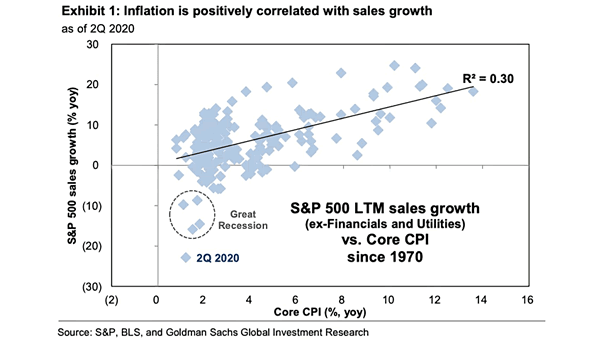
Inflation – S&P 500 LTM Sales Growth vs. Core CPI Since 1970

Inflation – S&P 500 LTM Sales Growth vs. Core CPI Since 1970 Rising inflation tends to boost S&P 500 earnings. According to Goldman Sachs, a 100bp increase in average annual core CPI would lift the S&P 500 EPS to $170 in 2021. Image: Goldman Sachs Global Investment Research

Inflation – Core PCE and CPI

Inflation – Core PCE and CPI Core PCE and core CPI are expected to decline substantially in 2022 and 2023. Will the Fed be more dovish than expected? Image: Goldman Sachs Global Investment Research

Inflation – U.S. Core Goods CPI

Inflation – U.S. Core Goods CPI U.S. core goods CPI is expected to decelarate markedly this year. Image: Morgan Stanley Research

Why Is Core Inflation So Low Compared to Previous Business Cycles?

Why Is Core Inflation So Low Compared To Previous Business Cycles? The Consumer Price Index Less Food & Energy (Core CPI) is very low compared to previous business cycles in the US, for several reasons: – not fast-rising money supply – globalization: inflation is a global phenomenon – lack of wage acceleration – increase in…