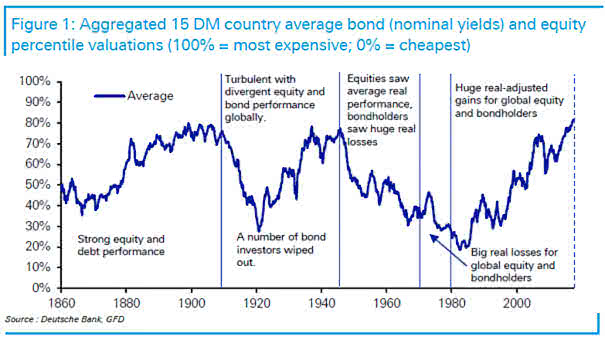
Aggregated 15 DM Country Average Bond and Equity Percentile Valuations
Aggregated 15 DM Country Average Bond and Equity Percentile Valuations As the chart suggests, this is the most expensive time to buy stocks and bonds. Image: Deutsche Bank
Aggregated 15 DM Country Average Bond and Equity Percentile Valuations As the chart suggests, this is the most expensive time to buy stocks and bonds. Image: Deutsche Bank
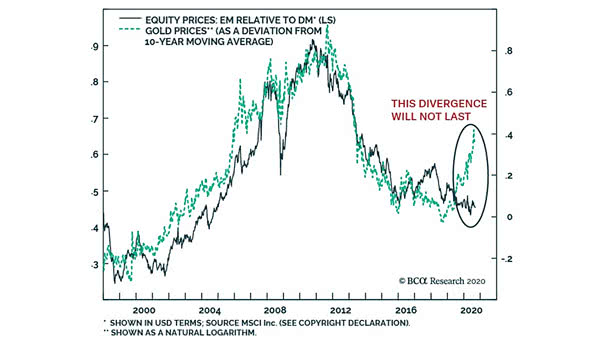
Equity Prices – EM Relative to DM vs. Gold Prices Is the relative performance of emerging market equities vs. developed market equities at a major market turning point? Image: BCA Research

Dividend Discount Model (DDM) Implied Equity Risk Premium (ERP) Goldman Sachs expects the equity risk premium to be lower moving forward, as the macro backdrop strengthens. Image: Goldman Sachs Global Investment Research
Average Annual U.S. GDP Growth by Administration This chart puts into perspective the average annual growth of U.S. GDP by administration. Image: Michael McDonough
Inflation in this Cycle (DM GDP Deflator) Morgan Stanley expects the return of inflation after the Great COVID-19 Recession (GCR). Image: Morgan Stanley Research
DM Real GDP and WTI Crude Oil (Leading Indicator) Chart suggesting that the 18-month rate of change of WTI crude oil (inverted) tends to lead DM real GDP by 18 months. Image: Topdown Charts
Incumbent Presidential Election Years Since 22nd Amendment Incumbent presidential election years have traditionally been good for equities, with an average return of 11.4% since 22nd amendment. Image: Morgan Stanley Research
The Treadmill of U.S. Oil Shale Chart suggesting that the treadmill of U.S. shale is accelerating. Image: Goldman Sachs Global Investment Research
Number of DM and EM Central Banks Easing Each Month Currently, most of the world’s central banks are easing, to boost money supply in the economy and stimulate economic growth. Image: J.P. Morgan
S&P 500 Equity Risk Premium and Global DM Composite PMI Nice chart showing that the equity risk premium of the S&P 500 is currently elevated. Image: JDI research
Different Holders of DM Government Debt The chart shows the historical breakdown of different holders of DM government bonds and overall DM debt-to-GDP. Even with QE, central bank government bond holdings are below historical peaks. Image: BlackRock Investment Institute