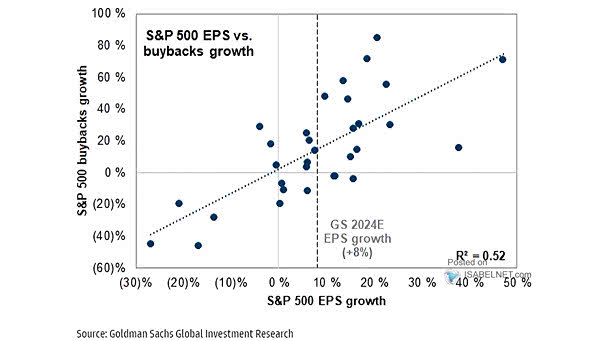
S&P 500 EPS Yield – IG Yield vs. TTM Buyback Yield
S&P 500 EPS Yield – IG Yield vs. TTM Buyback Yield Higher borrowing costs can discourage companies from engaging in stock buybacks. Image: BofA US Equity & Quant Strategy
S&P 500 Sectors Announced Buybacks (Last 3 Months) Announced buybacks are driven by specific sectors. Image: Deutsche Bank Asset Allocation
S&P 500 YoY Growth – Buybacks vs. Capex and R&D Will S&P 500 buyback growth continue to slow? Image: Goldman Sachs Global Investment Research
Buybacks – S&P 500 Index Return Decomposition Share buybacks account for a large portion of the total return of the S&P 500 Index. Image: True Insights
Number of U.S. Public Companies vs. the Net Percentage of Share Buyback for the S&P 500 The number of U.S. publicly traded companies is on the rise, thanks to a strong bull market. Image: BofA US Equity & Quant Strategy
Buybacks – S&P 500 Companies in Blackout Period The buyback blackout period is ending this week, which is good news for U.S. stocks. Image: Deutsche Bank Asset Allocation
S&P 500 – Buybacks and Shares Outstanding Stock buybacks are making a strong comeback this year as the economy recovers from the pandemic. Image: BCA Research
Buyback Basket Monthly Hit Rate of Outperformance vs. S&P 500 Buyback stocks tend to outperform the S&P 500. Image: Goldman Sachs Global Investment Research
S&P 500 Share Buyback Announcements The coronavirus pandemic stops share repurchases. Buyback authorizations have declined by 66% year-over-year. Image: Goldman Sachs Global Investment Research
Buybacks – Announced Share Repurchases for S&P 500 Companies S&P 500 buybacks fell to $88.7 billion in the second quarter. The trend is expected to continue in the third quarter. Image: J.P. Morgan