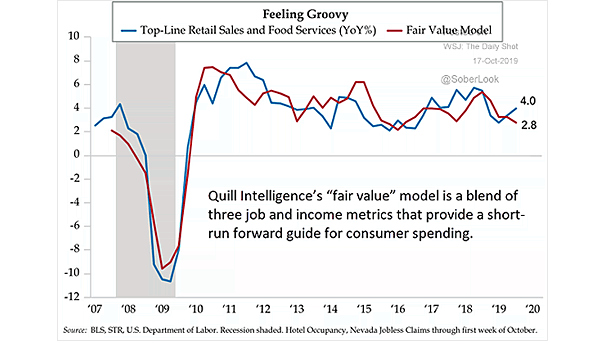
U.S. Retail Sales and Food Services vs. Fair Value Model

U.S. Retail Sales and Food Services vs. Fair Value Model After disappointing U.S. retail sales in September, this chart provides a good forward guide for U.S. consumer spending. The Fair Value Model leads consumption and includes: ASA Staffing Index (temps), spread between good unemployment (job leavers) and bad unemployment (job losers), and forward-looking income expectations.…
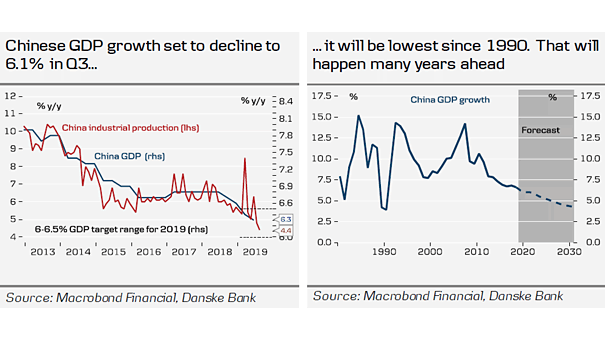
China GDP Growth

China GDP Growth China GDP growth is expected to continue to decline significantly in the coming years, with consumption becoming the main driver of growth. Image: Danske Bank Research

China Real GDP Growth Projection

China Real GDP Growth Projection Real GDP growth in China is expected to continue to decline significantly in the coming years, with consumption becoming the main driver of growth. You may also like “Contribution of Consumption to China’s GDP Growth.” Image: KKR & Co.

U.S. Core PCE vs. Fed Target

U.S. Core PCE vs. Fed Target The U.S. core personal consumption expenditures price index, which excludes food and energy, rises to 1.6% in June. Inflation trending back up toward the Fed’s 2% target is good news. You may also like “U.S. Core Inflation Expected Over the Next 21 Months.”