Evolution of Earnings Consensus
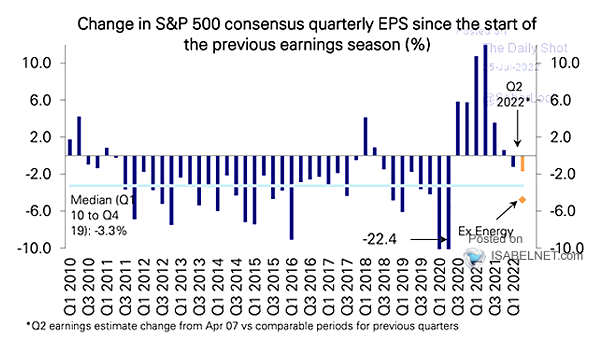
Evolution of Earnings Consensus After an initial wave of downward revisions, Q2 2025 consensus earnings estimates have stabilized and remained relatively flat over the past six weeks, with no significant cuts reported recently. Image: Deutsche Bank Asset Allocation