U.S. Headline and Core CPI Inflation

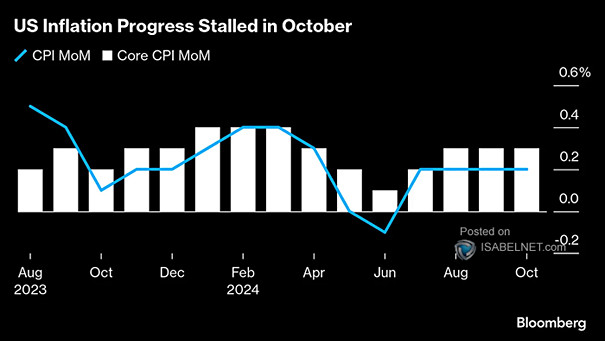
U.S. Headline and Core CPI Inflation The latest inflation data for October 2024 indicates that U.S. inflation has remained firm, showing a slight uptick rather than continuing its irregular descent, suggesting that the Fed’s battle against inflation is not yet over. Image: Bloomberg

Contributions to Year-on-Year Headline CPI Inflation

Contributions to Year-on-Year Headline CPI Inflation The combination of declining contributions from key sectors like shelter and transportation is expected to lead to a notable slowdown in U.S. headline CPI inflation, reaching 2.2% by the end of 2025. Image: Goldman Sachs Global Investment Research

U.S. Core CPI Inflation

U.S. Core CPI Inflation In September, U.S. core CPI inflation showed a modest increase of 0.312% month-over-month, indicating that inflation pressures are not significantly escalating. Image: Nomura

Citi U.S. Inflation Surprise Index

Citi U.S. Inflation Surprise Index Equities tend to perform well when the U.S. Economic Surprise Index increases, as this index indicates how much economic data surpasses expectations. Image: The Daily Shot

Inflation – U.S. Core PCE

Inflation – U.S. Core PCE The GS Core Inflation Tracker currently remains below the Federal Reserve’s target of 2%, which is a crucial component of its monetary policy aimed at ensuring price stability and anchoring inflation expectations. Image: Goldman Sachs Global Investment Research

U.S. Breakeven Inflation Rates vs. Oil

U.S. Breakeven Inflation Rates vs. Oil U.S. breakeven inflation rates closely track oil prices, creating a complex challenge for the Federal Reserve as it navigates potential deflationary pressures in the coming months. Image: Real Investment Advice

Inequality – Inflation Adjusted U.S. Household Net Worth by Brackets

Inequality – U.S. Household Net Worth by Brackets The widening wealth gap in the U.S. reflects deep-rooted structural issues that have persisted for decades. While some groups have gained, the overall trend indicates a growing divide that challenges economic mobility and social equity. Image: Real Investment Advice

G7 Inflation Average

G7 Inflation Average Current projections and trends suggest a return to 5% inflation is unlikely in the near term, but long-term structural changes and unforeseen shocks could alter this outlook. Image: BofA Global Investment Strategy

Inflation and Shipping Costs

Inflation and Shipping Costs Global shipping rates usually lead producer prices by six months, indicating a potential rise in the Consumer Price Index in the near future. Image: BofA Global Investment Strategy

U.S. CPI Inflation vs. U.S. 10-Year Bond Yield

U.S. CPI Inflation vs. U.S. 10-Year Bond Yield CPI dynamics in early 2024 show a clear pattern: Q1’s higher inflation prompted increased Fed scrutiny, while Q2’s declines suggest potential interest rate cuts, impacting market expectations and U.S. Treasury yields on CPI days. Image: BofA Global Research

Inflation – U.S. Core PCE and Core CPI

Inflation – U.S. Core PCE and Core CPI Goldman Sachs’ forecast of a continuous decline in U.S. core PCE and core CPI suggests a potential slowdown in inflationary pressures, which could have significant implications for the overall economic outlook. Image: Goldman Sachs Global Investment Research