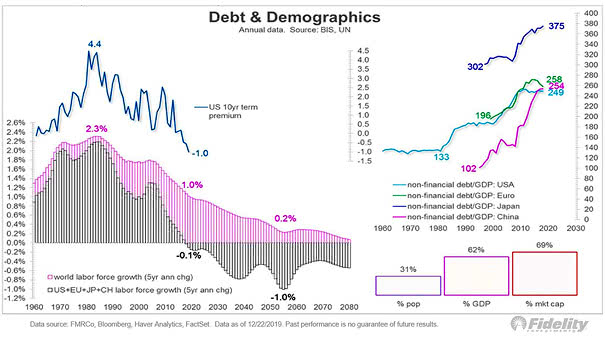
S&P 500 Cyclicals Relative to Defensives
S&P 500 Cyclicals Relative to Defensives Chart suggesting that S&P 500 cyclicals could outperform defensives in 2020, based on higher U.S. nominal GDP growth. Image: Stifel
Dollar Index vs. MSCI Emerging Markets Relative Performance Interesting chart showing the correlation of -0.89. Emerging markets could soar if the U.S. dollar falls. You may also like “Twin Deficits (% of GDP) Lead Real Trade Weighted Dollar Index by Two Years.” Image: Paolo Cardena
Detecting and Measuring Asset Bubbles Detecting and measuring asset bubbles is not always an easy task. This chart puts into perspective the current U.S. households financial assets to GDP and the U.S. federal debt as percentage of GDP.
How to Get Inflation? Mainly, inflation comes from excess money supply growth. There is too much money in the system chasing too few goods and services. Nominal GDP = M x V = P x T M = quantity of money V = velocity of circulation of money P = level of prices T =…
Where Does Inflation Come From? Mainly inflation comes from excess money supply growth. There is too much money in the system chasing too few goods and services. Over the long term, Nominal GDP = Money Supply x Velocity of Money = Inflation + Real Economic Growth “Inflation is always and everywhere a monetary phenomenon.” –Milton Friedman. You…