Nasdaq 100 Deviation from 200-Day Moving Average
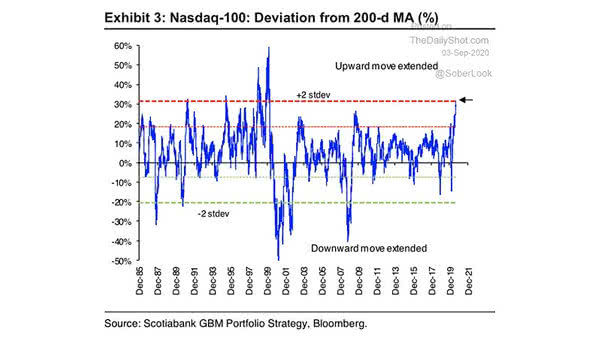
Nasdaq 100 Deviation from 200-Day Moving Average The risk of a reversion grows, as the Nasdaq 100 trades 2-standard deviations above the 200 DMA. Image: Scotiabank GBM Portfolio Strategy
Nasdaq 100 Deviation from 200-Day Moving Average The risk of a reversion grows, as the Nasdaq 100 trades 2-standard deviations above the 200 DMA. Image: Scotiabank GBM Portfolio Strategy
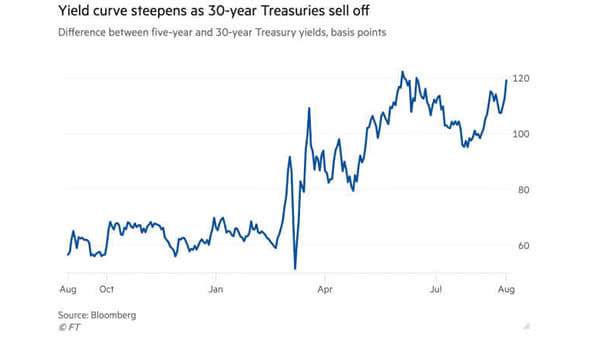
Yield Curve – Difference 5-Year and 30-Year Treasury Yields The yield curve steepens after the Fed pivot. Are Gold prices at risk? Image: Financial Times

U.S. 10-Year Government Bond Total Return vs. Price of Lumber The surge in lumber prices suggests downside risk for bond prices. Image: BCA Research
U.S. Dollar and Short Positions There is a risk of a short squeeze, as betting against the dollar is looking like a crowded trade. Image: Bloomberg
S&P 500 vs. Top 5 Stocks Does big tech present a risk for investors? Image: Financial Times
G10/USD Average August Performance Since 2010 Since 2010, G10 risk-on currencies tend to weaken in August. Image: Deutsche Bank
Estimated Share of Renter Households Facing a Rental Shortfall and Potential Eviction More than 40% of U.S. renters are at risk of eviction, as the Federal eviction moratorium has expired. Image: Statista
Global Real M1 vs. MSCI World Total Return (Leading Indicator) Global real M1 suggests that 2021 could be a good year for risky assets. Image: Nordea and Macrobond
U.S. Real M2 Growth and Inflation The United States is exposed to the risk of higher inflation, as the fiscal and monetary policies are the most expansionary. Image: Morgan Stanley Research
Cross-Asset Valuations on their 10-Year Range Equity risk premiums suggest that equities are still cheaper than average. Image: Morgan Stanley Research
Valuation – MSCI ACWI Index’s 12-Month Forward Price to Earnings The risk of a correction is rising, as global stocks continue to rally and become more expensive. Image: Bloomberg