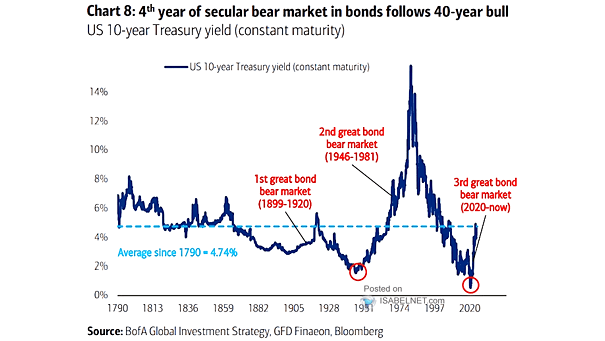
U.S. 10-Year Treasury Yield Since 1790
U.S. 10-Year Treasury Yield Since 1790 The trajectory and duration of the U.S. bond bear market can be influenced by factors such as inflation, economic growth, and the Federal Reserve’s monetary policy. Image: BofA Global Investment Strategy