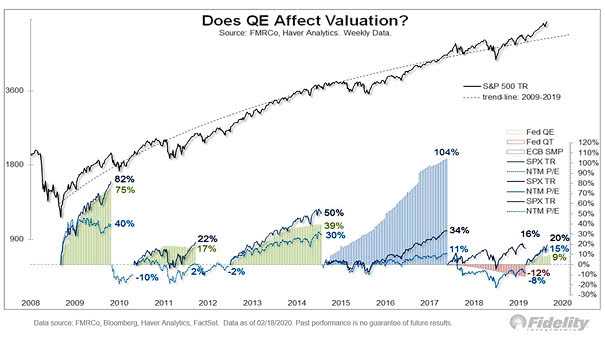
Does Quantitative Easing Affect Valuation?
Does Quantitative Easing Affect Valuation? More fundamentally, low interest rates, high margins, low taxes, buybacks & free cash flow drive stocks higher. Image: Fidelity Investments
Does Quantitative Easing Affect Valuation? More fundamentally, low interest rates, high margins, low taxes, buybacks & free cash flow drive stocks higher. Image: Fidelity Investments
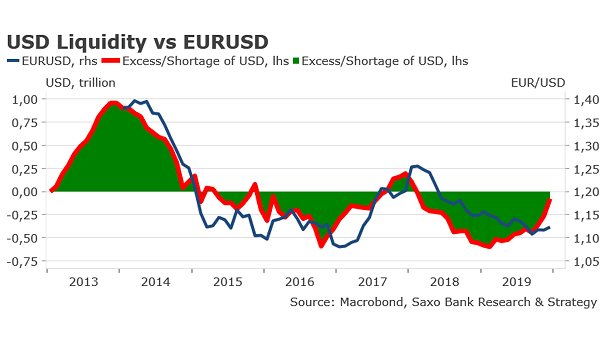
U.S. Dollar Liquidity vs. EUR/USD The inflow of U.S. dollar into the financial system should continue to grow this year and tends to support the euro against the US dollar. Image: Saxo Bank

Cumulative Net Buys of U.S. Equities by Pension Fund Clients Pension fund flows into U.S. equities have turned positive in 2H19. Image: BofA Merrill Lynch
U.S. Domiciled Funds: Active vs. Passive Record passive inflows suggest passive equity funds will surpass active in the coming years. Image: BofA Merrill Lynch US Equity & US Quant Strategy
Passive Over Active Funds History suggests that investor outflows from active funds are smallest after periods of high policy uncertainty. Image: Goldman Sachs Global Investment Research
Cumulative S&P 500 Buybacks 2009-2019 Are buybacks driving the show? Thanks to tax cuts and low interest rates, corporate stock buybacks are booming. Over the past decade, S&P 500 companies bought back $5 trillion shares, while cumulative flows from households and foreigners are only a drop in the bucket. But what would happend if companies reinvested instead…
Passive Equity Fund Assets vs. Active Record passive inflows suggest passive equity funds will surpass active by 2022. Image: BofA Merrill Lynch
S&P 500 Payout Ratio Stock buybacks and dividends as a percentage of free cash flow are reaching dangerous levels. Image: MarketWatch
The Rise of Passive Investing Net inflows into index-tracking U.S. mutual funds and ETFs rose by around 50% in the second quarter from a year earlier. Image: The Wall Street Journal
The Great Re-allocation from Equities to Bonds Continues Since the end of 2018, S&P 500 ETFs have seen outflows, while long Treasury ETFs have seen inflows. Image: Macrobond and Nordea
Decomposing the U.S. 10-Year minus 3-Month Treasury Yield Spread since 2013 This great chart shows that the “Global Economic Data” variable has a significant impact on the U.S. 10-year minus 3-month Treasury yield spread since 2018. An R² of 0.902 means that more than 90 percent of the variance in the U.S. 10-year minus 3-month Treasury yield spread…