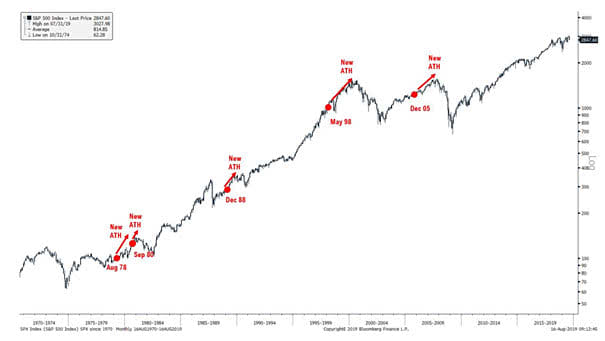
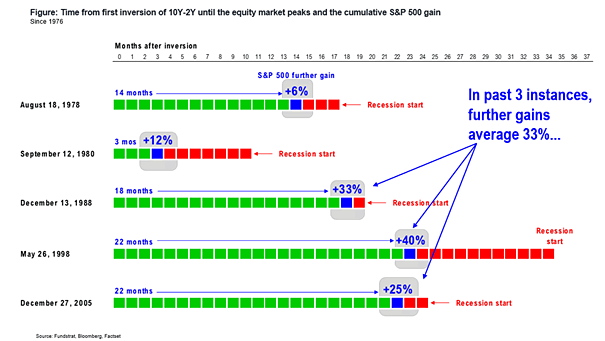
S&P 500 All-Time High and Inverted Yield Curve

S&P 500 All-Time High and Inverted Yield Curve The S&P 500 tends to rise after an inverted yield curve. It has made new all-time highs 5 of 5 times the 10Y-2Y yield curve inverted. Image: Fundstrat Global Advisors, LLC

Wage Growth, Monetary Policy and S&P 500

Wage Growth, Monetary Policy and S&P 500 When the spread between wage growth and the Fed funds rate is wide, it is generally positive for equities. Image: Topdown Charts

U.S. Active vs. Passive Fund Net Flows

U.S. Active vs. Passive Fund Net Flows Active mutual funds exhibit persistent outflows, while inflows into index-tracking U.S. mutual funds and ETFs continue to rise. Image: Bloomberg

Active Equity Managers Still Underperform

Active Equity Managers Still Underperform This chart shows the low percentage of active funds that outperformed and how difficult it really is to beat the market over time. You may also like “The Rise of Passive Investing.” Image: PIMCO

U.S. Yield Curve vs. Recessions

U.S. Yield Curve vs. Recessions The chart shows the 10-year Treasury yield minus Fed funds rate yield curve and recessions. Historically, a flat or inverted yield curve is associated with slow economic growth or recessions. The longer the yield curve stays inverted, the better it predicts recession. A Fed rate cut similar to 1995 could…

The Rise of Passive Investing

The Rise of Passive Investing Net inflows into index-tracking U.S. mutual funds and ETFs rose by around 50% in the second quarter from a year earlier. Image: The Wall Street Journal

S&P 500 and Hedge Fund Exposure

S&P 500 and Hedge Fund Exposure While the S&P 500 is at all-time high, hedge funds increase their exposure to equities (last = 0.52). Image: Sentimentrader

The Yield Curve Leads VIX (Volatility) by Three Years

The Yield Curve Leads VIX (Volatility) by Three Years Is more volatility expected ahead? This chart suggests that the CBOE Volatility Index or VIX usually follows the U.S. 10-year vs. 3-month Treasury spread (inverted) with a 3-year lag. You may also like “VIX is in a Transitory State” and “Fed Funds Target Rate and VIX.”…

The Market Has Correctly Called Each Fed Rate Decision since 2010

The Market Has Correctly Called Each Fed Rate Decision since 2010 And since 1994, seven days before a FOMC meeting, the market has been accurate 95% of the time. You may also like “The Fed Funds Market Is Rarely Wrong About the Next FOMC Meeting.” Image: Deutsche Bank