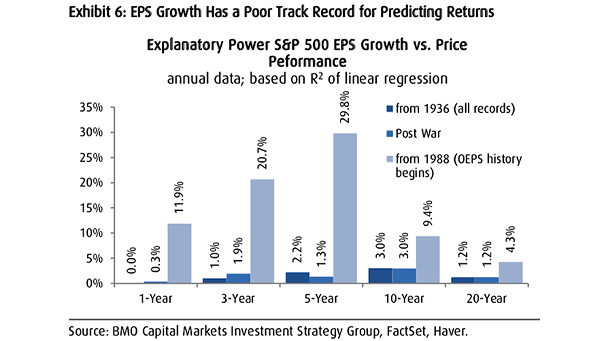
S&P 500 EPS Growth vs. Price Performance
S&P 500 EPS Growth vs. Price Performance Chart showing the poor relationship between earnings growth and market performance, even in the long term. Image: BMO Capital Markets Investment Strategy Group
S&P 500 EPS Growth vs. Price Performance Chart showing the poor relationship between earnings growth and market performance, even in the long term. Image: BMO Capital Markets Investment Strategy Group
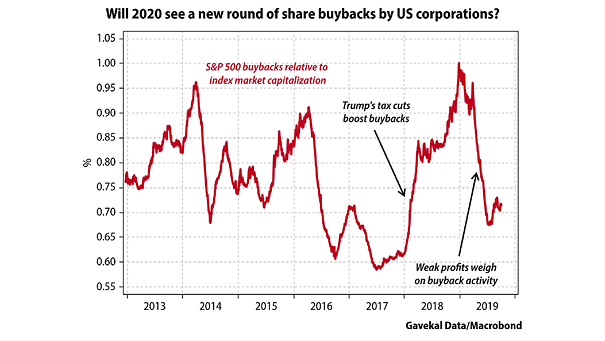
S&P 500 Buybacks Relative to Index Market Capitalization A recovery in corporate earnings could lead to a rebound in buybacks this year. Image: Gavekal, Macrobond

Median S&P 500 EPS Growth The median S&P 500 stock is expected to grow earnings per share by 8% this year. Image: Goldman Sachs Global Investment Research
Global PMIs Global PMIs and earnings growth across regions could suggest a strong risk-on year. Image: Fidelity Investments
U.S. Corporate Profits and 10Y-3M Yield Curve While the divergence between large-cap profits and the rest of the economy is the widest on record, the steepening yield curve suggests an earnings rebound. Image: BofA Global Research
MSCI U.S. EPS vs. Trend History shows that earnings well above the trend in the U.S. precede earning plunges. Image: Barclays Research
S&P 500 EPS Forecast Despite the earnings squeeze, Goldman Sachs is still positive on the S&P 500 earnings outlook. In 2020, U.S. and global growth should rebound modestly. Image: Goldman Sachs Global Investment Research
Buybacks and Dividends as Percentage of Market Capitalization Amid gloomy earnings, U.S. companies are increasingly using debt to fund buybacks and dividends. Image: Institute of International Finance
S&P 500 All-Time Highs Today, S&P 500 jumps to record high on strong earnings. This chart shows S&P 500 all-time highs since 1982. Image: Ritholtz Wealth Management LLC.
MSCI World Index Valuation at Cycle Peaks and Troughs On average, the MSCI World Index currently trades at a price-to-earnings ratio that has marked cyclical peaks in the stock market over the past 50 years. Image: Charles Schwab
U.S. ISM Manufacturing Index and Cyclicals EPS Revision This chart shows the correlation between the ISM Manufacturing Index and cyclicals EPS revision, suggesting that 4Q19 will see a reset, with capital goods pricing in an actual earnings recession. Image: Morgan Stanley Research