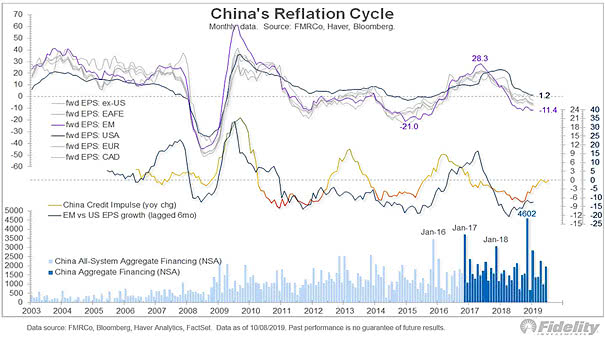
S&P 500 Current P/E Valuation Based on 2021 EPS Scenarios

S&P 500 Current P/E Valuation Based on 2021 EPS Scenarios Goldman Sachs baseline forecast for S&P 500 earnings in 2021 is $170, and the downside forecast is $115. Today, the S&P 500 trades at 19.5x the buy-side estimate of EPS. Image: Goldman Sachs Global Investment Research

S&P 500 and Dividend Futures

S&P 500 and Dividend Futures This chart suggests that the S&P 500 does appear to be trading off dividend forecasts more than earnings. Image: Morgan Stanley Research

S&P 500 Index vs. Reported EPS

S&P 500 Index vs. Reported EPS This chart shows the very high correlation between stock prices and earnings since 1871 (R² = 0.97) Image: Fidelity Investments

Annual S&P 500 EPS Growth

Annual S&P 500 EPS Growth Goldman Sachs expects no earnings growth this year. Image: Goldman Sachs Global Investment Research

S&P 500 Management Guidance Ratio

S&P 500 Management Guidance Ratio The S&P 500 earnings guidance ratio has been declining to its lowest level since 2015. Image: BofA US Quantitative Strategy

S&P 500 EPS Growth vs. Price Performance

S&P 500 EPS Growth vs. Price Performance Chart showing the poor relationship between earnings growth and market performance, even in the long term. Image: BMO Capital Markets Investment Strategy Group

Global PMIs

Global PMIs Global PMIs and earnings growth across regions could suggest a strong risk-on year. Image: Fidelity Investments

U.S. Corporate Profits and 10Y-3M Yield Curve

U.S. Corporate Profits and 10Y-3M Yield Curve While the divergence between large-cap profits and the rest of the economy is the widest on record, the steepening yield curve suggests an earnings rebound. Image: BofA Global Research

MSCI U.S. EPS vs. Trend

MSCI U.S. EPS vs. Trend History shows that earnings well above the trend in the U.S. precede earning plunges. Image: Barclays Research