PCE Inflation vs. Output Gap (Leading Indicator)
PCE Inflation vs. Output Gap (Leading Indicator) Positive output gap suggests higher core inflation next year. Image: NBF Economics and Strategy
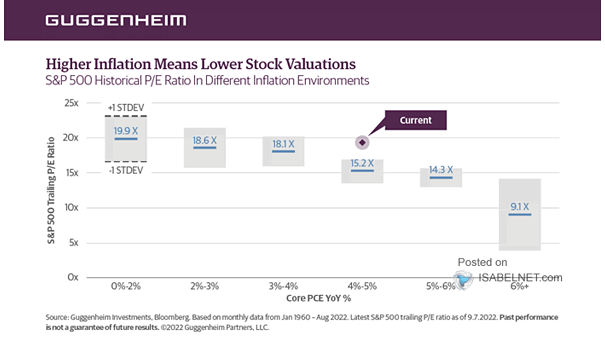
Valuation – S&P 500 Historical P/E Ratio in Different Inflation Environments Should U.S. equity investors expect lower stock valuations, as U.S. core PCE remains elevated? Image: Guggenheim Partners
U.S. Transitory Inflation Meter Is U.S. inflation transitory? The BofA US transitory inflation meter remains at 100. BofA expects core PCE inflation will settle down to 2.1% by the end of 2022. Image: BofA Global Research
U.S. Output Gap (% of potential GDP) and Inflation U.S. output gap (% of potential GDP) tends to lead underlying core PCE by 12 months. Image: Pictet Asset Management
Euro Area and U.S. Inflation and Central Bank Forecasts The Fed projects U.S. inflation well above 2% into 2023. Image: BlackRock Investment Institute