Commodity, ISM Prices and Core PCE Price Index (Inflation)
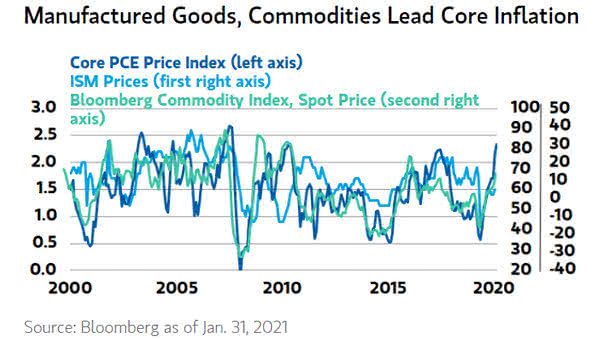
Commodity, ISM Prices and Core PCE Price Index (Inflation) Commodities and manufactured goods tend to lead core inflation. Image: Morgan Stanley Wealth Management
Commodity, ISM Prices and Core PCE Price Index (Inflation) Commodities and manufactured goods tend to lead core inflation. Image: Morgan Stanley Wealth Management
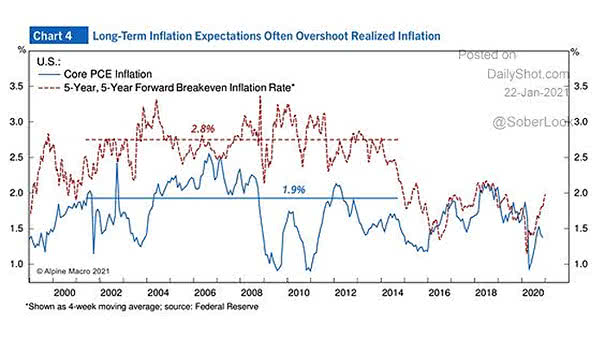
Core PCE Inflation and 5-Year, 5-Year Forward Breakeven Inflation Rate Are inflation expectations too high? Image: Alpine Macro

Inflation – U.S. Core PCE Deflator This chart could suggest more inflation ahead. Image: Alpine Macro
Valuation – Average Forward P/E in Core PCE Inflation Ranges Since 1976 Historically, inflation generally had a negative impact on valuations when core PCE approached 2%, in the anticipation of rate hikes. Image: Goldman Sachs Global Investment Research
Fed Funds Rate Less Core PCE and Real U.S. 10-Year Government Bond Yields Chart suggesting that monetary policy is becoming too tight. Image: Danske Research
U.S. Business Cycle: Output Gap vs. Core PCE Inflation The mature phase of the U.S. business cycle began 24 months ago. The mature phase lasted 72 months in the late 1960s and 57 months in the late 1990s. Image: NBF Economics and Strategy
Core Inflation Difference (vs. U.S. core PCE) Leads EUR/USD This chart suggests that the core inflation difference (vs. U.S. core PCE) leads the EUR/USD by four months. Image: Nordea and Macrobond
U.S. Core PCE vs. Fed Target The U.S. core personal consumption expenditures price index, which excludes food and energy, rises to 1.6% in June. Inflation trending back up toward the Fed’s 2% target is good news. You may also like “U.S. Core Inflation Expected Over the Next 21 Months.”
Contributions to Annualized U.S. PCE Growth The U.S. stock market’s recent underperformance is expected to reduce the wealth effect, turning it from a boost to a drag on consumption and increasing the risk of a broader economic slowdown as consumer spending weakens. Image: Goldman Sachs Global Investment Research
PCE Inflation vs. Output Gap (Leading Indicator) Positive output gap suggests higher core inflation next year. Image: NBF Economics and Strategy
Inflation Forecasts If Trump implements a 25% tariff on imports from Canada and Mexico, along with a 10% tariff on imports from China, it could push U.S. core PCE inflation above 3% in 2025. Image: Deutsche Bank