Average S&P 500 Returns Around Recessionary Bear Markets
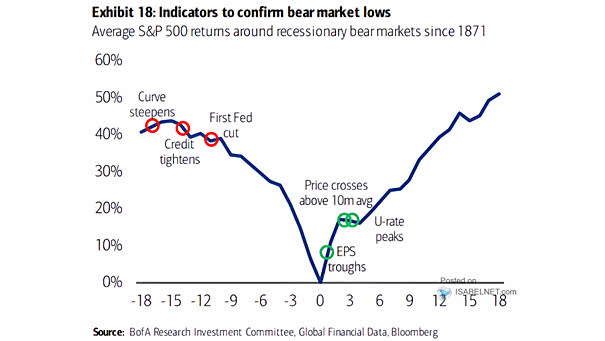
Average S&P 500 Returns Around Recessionary Bear Markets There are several indicators that can be used to confirm recessionary bear market lows. Image: BofA Research Investment Committee
Average S&P 500 Returns Around Recessionary Bear Markets There are several indicators that can be used to confirm recessionary bear market lows. Image: BofA Research Investment Committee
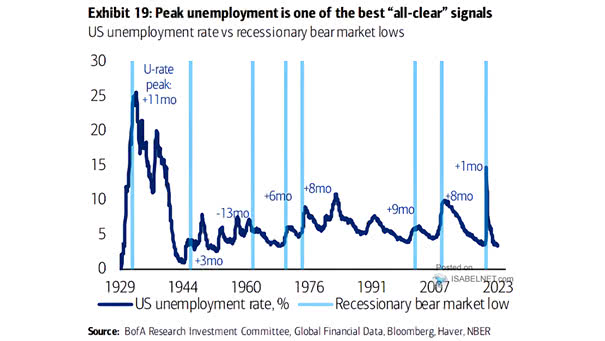
U.S. Unemployment Rate vs. Recessionary Bear Market Lows The peak in unemployment can be used as a signal for the end of a recessionary bear market in U.S. stocks. Image: BofA Research Investment Committee

S&P 500 – Seasonality During Bull vs. Bear Markets – 3rd Year of U.S. Election Cycle Only Both bulls and bears may be frustrated this year. Image: Topdown Charts
Bear Market Rally or New Bull Market? Most FMS investors do not think this is a new bull market. Image: BofA Global Fund Manager Survey
Average S&P 500 Return Before and During Bear Markets The S&P 500 does not price in a U.S. recession. Image: TS Lombard
S&P 500 Bear Markets How long will the S&P 500 bear market last? Image: MarketDesk Research
Valuation – S&P 500 NTM P/E – Bear Market Troughs The current S&P 500 valuation may suggest that U.S. stocks have not bottomed out. Image: KKR & Co.
Sentiment – Consecutive Weeks of Negative Bull-Bear Spread Negative sentiment persists among investors. Image: Deutsche Bank Asset Allocation
S&P 500 – Seasonality During Bull vs. Bear Markets (Midterm Election Years Only) Historically, the Santa Claus rally tends to occur only in bull markets during midterm election years. Image: Topdown Charts
ISM Around Bear Markets The ISM tends to reach 40-44 in cyclical bear markets. Image: Goldman Sachs Global Investment Research
U.S. Bear Markets Rallies Bear markets rallies tend to be sharp and short-lived. Image: MarketDesk Research