U.S. Economy – Exports and Imports Annual Growth
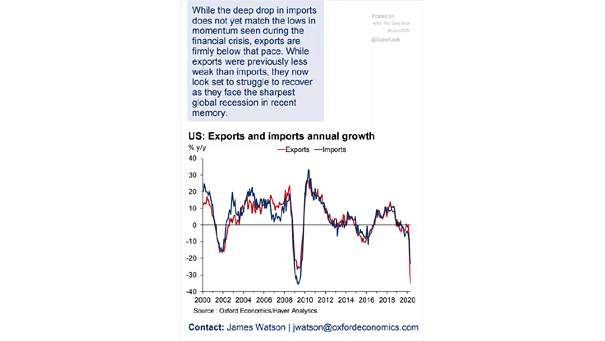
U.S. Economy – Exports and Imports Annual Growth In May, US exports sank to 11-year low, and imports dropped as demand for goods slows. Image: Oxford Economics
U.S. Economy – Exports and Imports Annual Growth In May, US exports sank to 11-year low, and imports dropped as demand for goods slows. Image: Oxford Economics
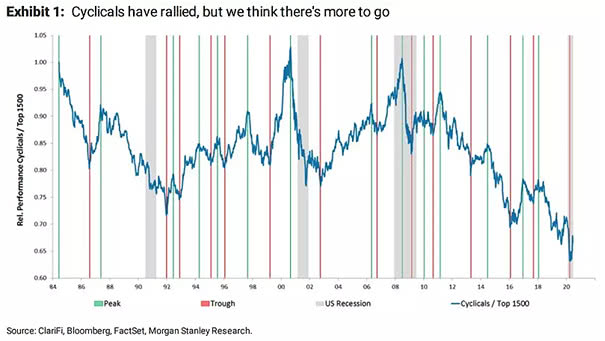
Cyclicals/Top 1500 and U.S. Recession Morgan Stanley sees a massive upside in cyclical shares, in a sharp V-shaped economic recovery. Image: Morgan Stanley Research

Eurozone Real M1 Money Supply Growth vs. Real GDP Growth This chart suggests the relationship between real M1 growth and euro area GDP growth. Image: Longview Economics
Fed Funds vs. Employment/Population + Inflation This chart suggests the optimal monetary policy, while Fed officials do not anticipate any rate hikes until 2022. Image: Oxford Economics
Job Losses During Recessions in the U.S. The March-May job loss is two times larger than the total GFC job loss. On the positive side, U.S. job losses see revival in May. Image: Oxford Economics
Impact of Global Warming on World GDP (CO2 Emission) This chart suggests the impact of global warming on world GDP. Image: Oxford Economics
U.S. Initial Claims for Unemployment U.S. new weekly jobless claims fall below 2 million, but remain high. Image: Oxford Economics
Gold vs. U.S. 10-Year Treasury Real Yield Generally, when U.S. real yields go up, gold goes down. Source: Scotiabank Economics
Global Recession Could the global recession last a long time? Image: Oxford Economics
GDP and Shape of Recovery V-shaped or Swoosh? This chart shows the alphabet of economic recovery scenarios. Image: Financial Times
EU Recovery Funds and Proposed Allocation of Fund by Country The European Commission is proposing a 750 billion euro recovery fund. This chart shows who gets what as a percentage of GDP. Image: Oxford Economics