U.S. Initial Claims for Unemployment
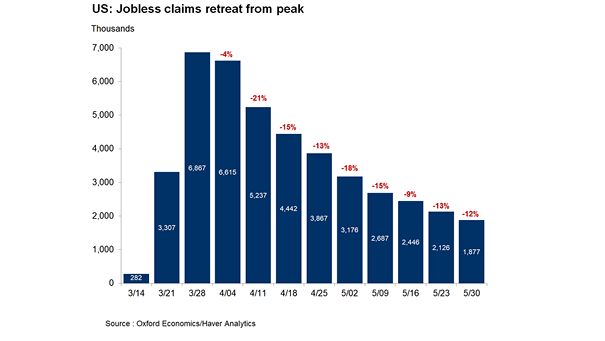
U.S. Initial Claims for Unemployment U.S. new weekly jobless claims fall below 2 million, but remain high. Image: Oxford Economics
U.S. Initial Claims for Unemployment U.S. new weekly jobless claims fall below 2 million, but remain high. Image: Oxford Economics
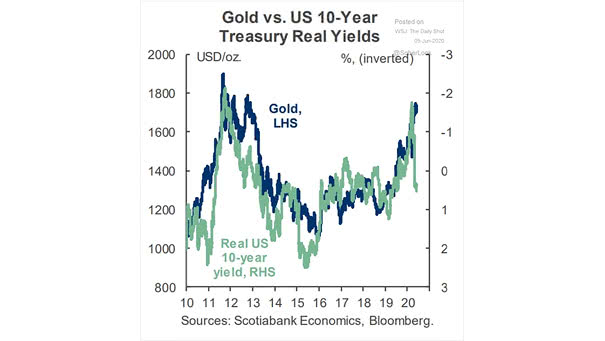
Gold vs. U.S. 10-Year Treasury Real Yield Generally, when U.S. real yields go up, gold goes down. Source: Scotiabank Economics

Global Recession Could the global recession last a long time? Image: Oxford Economics
GDP and Shape of Recovery V-shaped or Swoosh? This chart shows the alphabet of economic recovery scenarios. Image: Financial Times
EU Recovery Funds and Proposed Allocation of Fund by Country The European Commission is proposing a 750 billion euro recovery fund. This chart shows who gets what as a percentage of GDP. Image: Oxford Economics
CPI vs. Conference Board Inflation Expectations Coordinated monetary and fiscal easing should lift inflation higher in this cycle. Image: Pantheon Macroeconomics
China Recovery China recovery is well underway, suggesting a quick economic recovery. Image: Morgan Stanley Research
U.S. Retail Sales in March-April 2020 U.S. retail sales from March to April is dramatic and tumbled by a record 16.4%. Image: Oxford Economics
Delinquency – U.S. Unemployment Rate and Mortgage Loans Past Due The rising unemployment rate in the United States should increase the delinquency rate. Image: Oxford Economics
U.S. Job Losses During Recessions The U.S. jobs report for April brings sobering news. Image: Oxford Economics
ISM Manufacturing PMI vs. Cyclicals/Defensives The outperformance of U.S. cyclicals could suggest that the U.S. economic activity has bottomed. Image: Gavekal, Macrobond