Seasonality of Monthly Spikes in the VIX
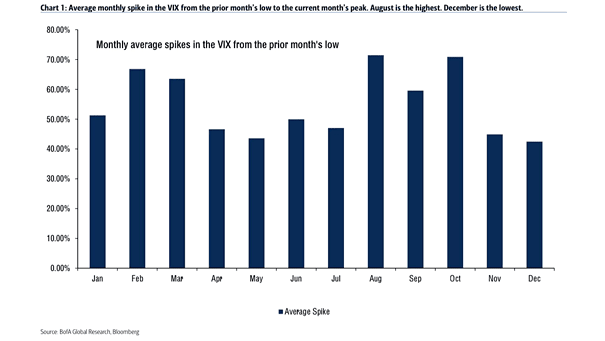
Seasonality of Monthly Spikes in the VIX Historically, there are higher than average VIX spikes in August, September and October. Image: BofA Global Research
Seasonality of Monthly Spikes in the VIX Historically, there are higher than average VIX spikes in August, September and October. Image: BofA Global Research
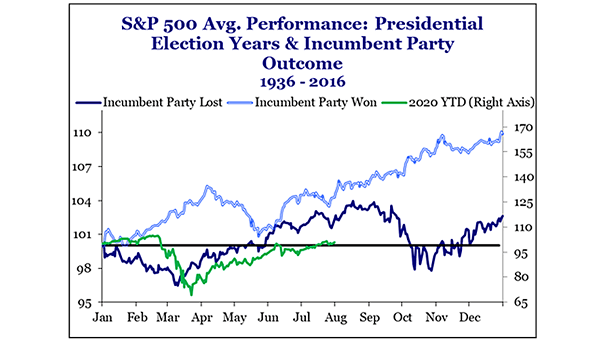
S&P 500 Average Performance – Presidential Election Years & Incumbent Party Outcome 1936-2016 The S&P 500 has been a great indicator in the three months prior to the U.S. presidential election. Historically, the S&P 500’s performance has been 87% accurate in predicting the winner of the election. When the S&P 500’s performance was positive, the…

S&P 500 Trailing 10-Year Total Return vs. Forward 10-Year Returns Historically, forward 10-year S&P 500 returns are not correlated with trailing 10-year returns. Image: Goldman Sachs Global Investment Research
Blended Money Supply vs. U.S. Nominal GDP Historically, U.S. nominal GDP growth tends to track money supply growth. More inflation to come? Image: Deutsche Bank
S&P 500 and Chicago Fed National Financial Conditions Index Fed financial conditions continue to improve, which is historically bullish for U.S. equities. Image: BofA Global Research
Seasonality – S&P 500 1-Month & Percentage of Time Up If you “sell in May and go away”, you could miss a summer rally, as June-August is historically the second best 3-month period. Image: BofA Global Research
Major U.S. Mutual Funds’ Net Exposure to U.S. Equities U.S. equity exposure of major U.S. mutual funds is in line with the historical average. Image: Nomura
Central Bank Ownership of Domestic Government Debt This chart shows the rise of central banks as holders of sovereign debt, pushing sovereign yields to historically low levels. Image: Deutsche Bank Global Research
S&P 500 Index Total Return Drivers Historically, earnings growth drives equity returns over time. Image: Morgan Stanley Research
U.S. Credit Impulse as % of GDP vs. U.S. Private Domestic Demand Growth Credit growth in the U.S. has historically been a good indicator of underlying GDP growth. Image: Deutsche Bank