S&P 500 DDM-Implied Fair Value
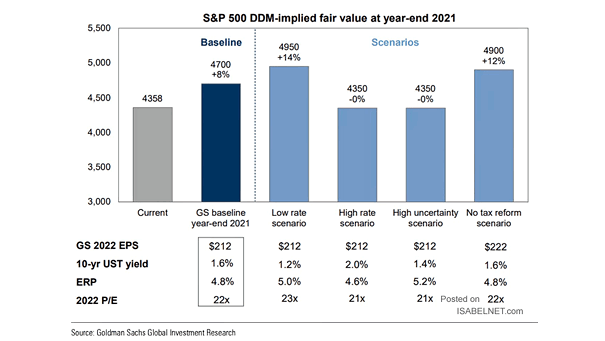
S&P 500 DDM-Implied Fair Value Goldman Sachs forecasts the U.S. 10-year Treasury yield at 1.6% by the end of 2021 and the S&P 500 to reach 4,700 (base case scenario). Image: Goldman Sachs Global Investment Research
S&P 500 DDM-Implied Fair Value Goldman Sachs forecasts the U.S. 10-year Treasury yield at 1.6% by the end of 2021 and the S&P 500 to reach 4,700 (base case scenario). Image: Goldman Sachs Global Investment Research
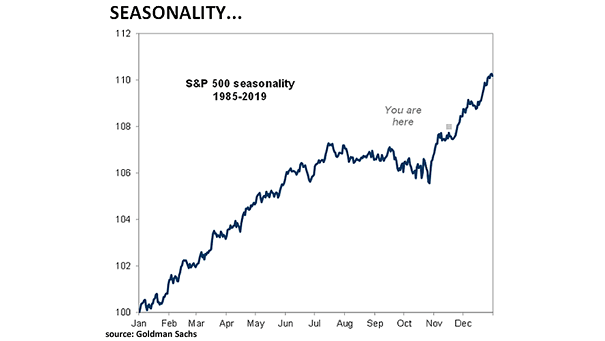
S&P 500 Seasonality Since 1985 Chart showing the S&P 500 seasonality from 1985 to 2019. This is not a forecast. Image: Goldman Sachs Global Investment Research

S&P 500 Earnings Surprise Current estimates are forecasting an earnings surprise of 14.6% for the S&P 500, well above the long-run average of 7%. Image: J.P. Morgan Asset Management
S&P 500 Equity Risk Premium (ERP) Goldman Sachs forecasts the ERP will fall to 4.6% this year and 4.3% in 2022. Image: Goldman Sachs Global Investment Research
S&P 500 EPS Growth Estimates with Potential Lockdowns Goldman Sachs baseline forecast for S&P 500 EPS is $175 by the end of 2021. Image: Goldman Sachs Global Investment Research
Distribution of S&P 500 Calendar Year Returns Goldman Sachs forecasts S&P 500 will climb by 16% to 4,300 by the end of 2021. Image: Goldman Sachs Global Investment Research
Potential Impact of Biden-Harris Policy Agenda on S&P 500 EPS The S&P 500 EPS forecast depends on fiscal stimulus and corporate tax reform. Image: Goldman Sachs Global Investment Research
% of S&P 500 Companies Beating Quarterly EPS Estimates vs. U.S. Manufacturing ISM So far, 84% of S&P 500 companies have exceeded estimates, thanks to coronavirus cuts to forecasts. Image: J.P. Morgan
S&P 500 Current P/E Valuation Based on 2021 EPS Scenarios Goldman Sachs baseline forecast for S&P 500 earnings in 2021 is $170, and the downside forecast is $115. Today, the S&P 500 trades at 19.5x the buy-side estimate of EPS. Image: Goldman Sachs Global Investment Research
S&P 500 and Dividend Futures This chart suggests that the S&P 500 does appear to be trading off dividend forecasts more than earnings. Image: Morgan Stanley Research
S&P 500 Total Return Index and Actual Forward 10-Year Rate of Return This chart suggests that the long-term return forecast is around 3.5% now vs. 8% p.a. at March bottom (R² = 0.91). Image: Hondo Tomasz