U.S. Dollar and Global Liquidity
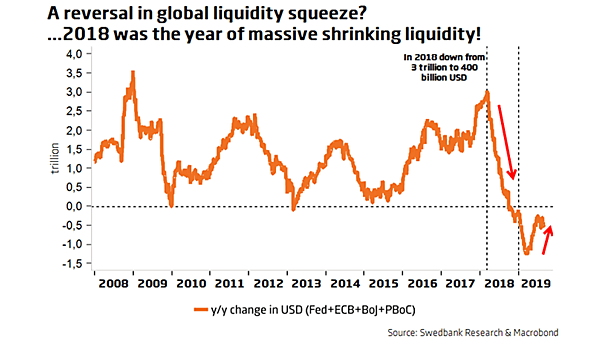
U.S. Dollar and Global Liquidity In 2018, global liquidity fell at the fastest rate since the global financial crisis. This chart suggests that a reversal in global liquidity lies ahead. Image: Swedbank Research
U.S. Dollar and Global Liquidity In 2018, global liquidity fell at the fastest rate since the global financial crisis. This chart suggests that a reversal in global liquidity lies ahead. Image: Swedbank Research
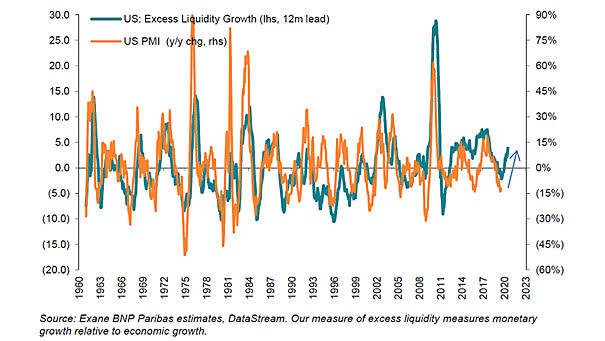
U.S. Excess Liquidity Leads U.S. PMI This chart suggests that U.S. excess liquidity leads U.S. PMI by 12 months. U.S. PMI could bounce back in 2020. Image: Exane BNP Paribas

U.S. Excess Liquidity Growth Leads S&P 500 Returns This chart suggests that M2 money supply to nominal GDP ratio leads S&P 500 returns by one year. Is the S&P 500 vulnerable to a drop, followed by a recovery? Image: Oxford Economics, Macrobond
Liquidity Premium: Investment Grade vs. High Yield Bonds The chart shows that the premium provided by illiquid IG and HY bonds has been drifting wider. Image: Goldman Sachs Global Investment Research
Liquidity in U.S. Equity Futures Liquidity in U.S. equity futures collapsed in early 2018. It has remained at very low levels. The lack of liquidity could lead to violent market moves. Image: Deutsche Bank
S&P 500 Index vs. Global M1 Liquidity Another good correlation between the S&P 500 Index and global M1 liquidity, while the Fed plans to stop quantitative tightening. The money supply M1 is the amount of effective money in the economy. Image: Nordea and Macrobond
International Liquidity by Country – Total Reserves Excluding Gold, U.S. Dollars USA holds $115 billion and China holds over $3 trillion in reserves. Image: howmuch.net
Implied Probability of the S&P 500 Rising over the Next Six Months with a Cutoff Set at 75% JPMorgan’s AI-enhanced forecasting model indicates a 96% probability that U.S. stocks will rise over the next six months, giving investors a data-driven reason for optimism about the market outlook. Image: J.P. Morgan Flows and Liquidity
U.S. Inflation Expectations U.S. inflation expectations have declined over the past month, making consumers more optimistic than in April. However, sentiment is still weaker than six months ago, with uncertainty persisting due to ongoing tariff policies. Image: Yahoo Finance
Median S&P 500 Stock Bid-Ask Spread Bid-ask spreads for S&P 500 stocks have widened significantly in recent trading sessions, driven by heightened market volatility and liquidity strains. Image: Goldman Sachs Global Investment Research
Fed Balance Sheet Goldman Sachs predicts the Fed will slow its balance sheet reduction in June 2025 and end quantitative tightening by September, which could influence market liquidity and interest rates. Image: Goldman Sachs Global Investment Research