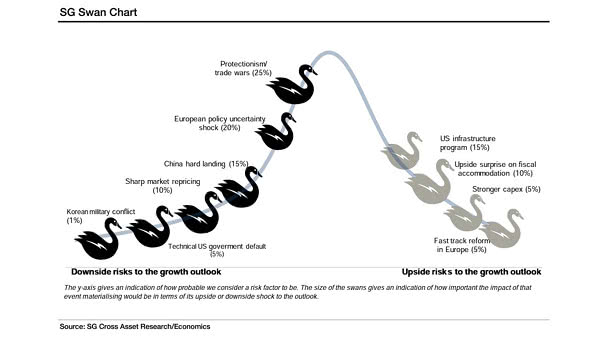
Societe Generale’s Chart of Swan Risks
Societe Generale’s Chart of Swan Risks This chart shows the downside and upside risks to the growth outlook. Biggest risks (black swan): protectionism/trade wars (25%), and European policy uncertainty (20%) Image: Societe Generale Cross Asset Research