For Professionals and Individuals
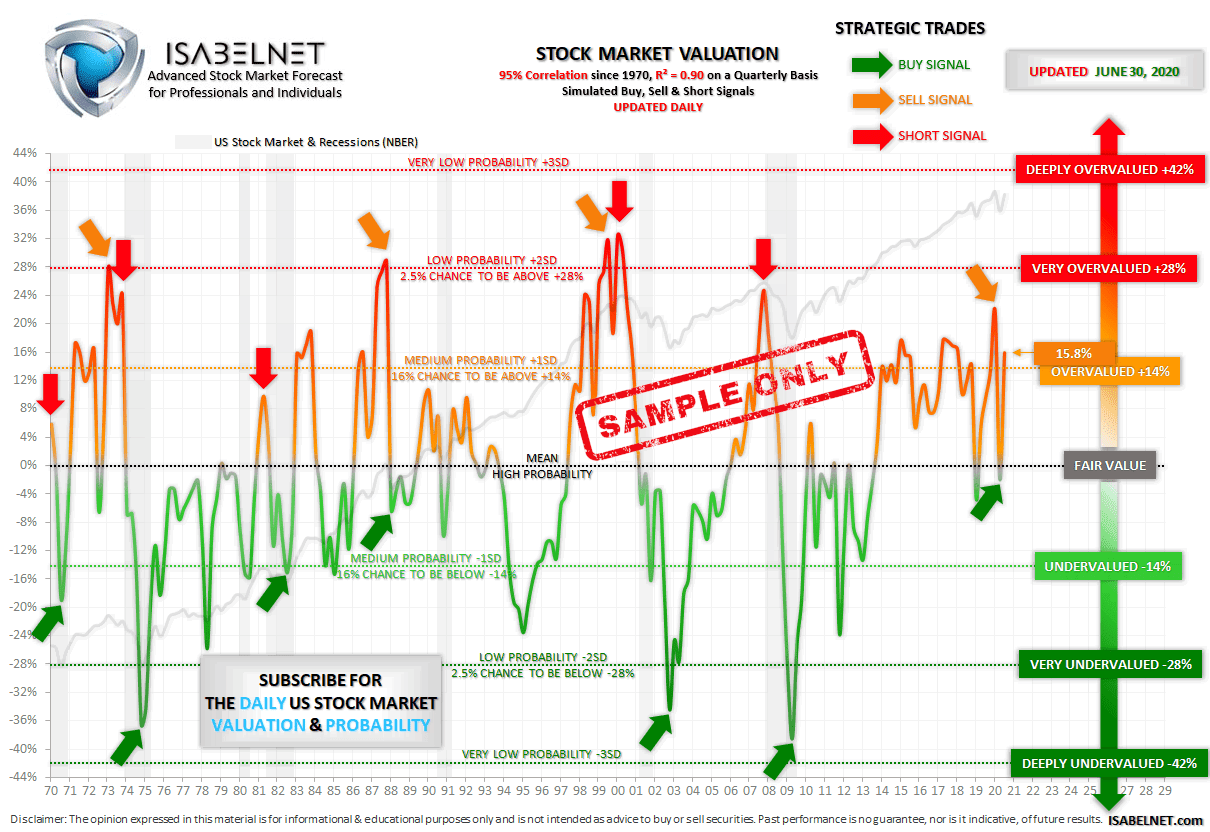
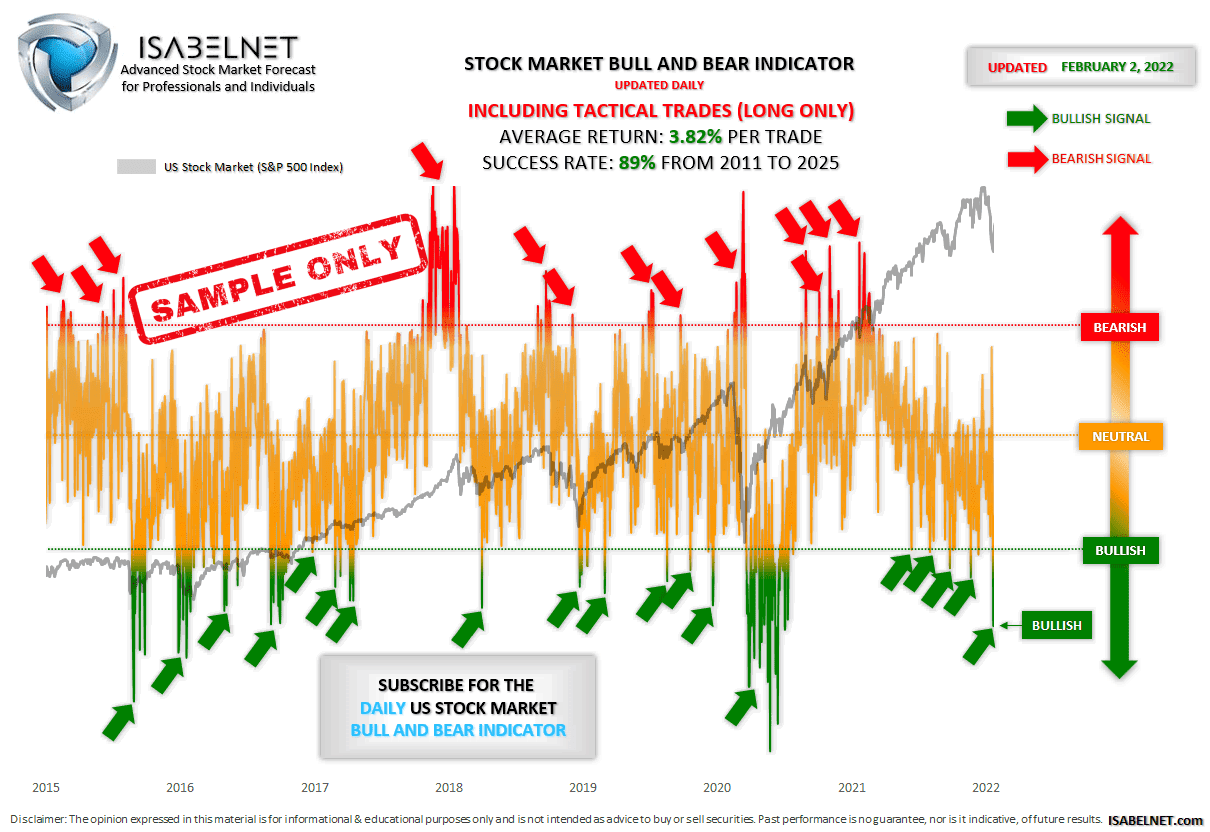

U.S. Stock Market Bull and Bear Indicator
U.S. Stock Market Bull and Bear Indicator Three Mondays ago, our Stock Market Bull & Bear Indicator tilted bullish before the opening bell, and the S&P 500 closed up 0.47% on the day. The model’s job is to gauge the market’s tilt—bull, bear, or neutral—at any moment. Using multiple financial data, this great model helps…
Investor Sentiment – U.S. Market Greed/Fear Index
Investor Sentiment – U.S. Market Greed/Fear Index A 74.04 print on the Greed and Fear Index tells the story of a market brimming with confidence but quietly mindful of how quickly euphoria can fade. Image: Real Investment Advice
S&P 500 Returns when New Highs Are Made in August, September, and October
S&P 500 Returns when New Highs Are Made in August, September, and October History is on the bulls’ side: whenever the S&P 500 has hit new highs in August, September, and October, the fourth quarter has never finished in the red since 1950—a track record market participants can’t ignore. Image: Carson Investment Research
"Your results are very interesting"
"Very impressive"
"I look forward to reviewing it"
"Your mathematical predictions were intriguing"
Lou Simpson
former Warren Buffett CIO
"Good stuff here everyone. Charts are very informative"
Jim Osman
CEO of the Edge & Forbes Contributor