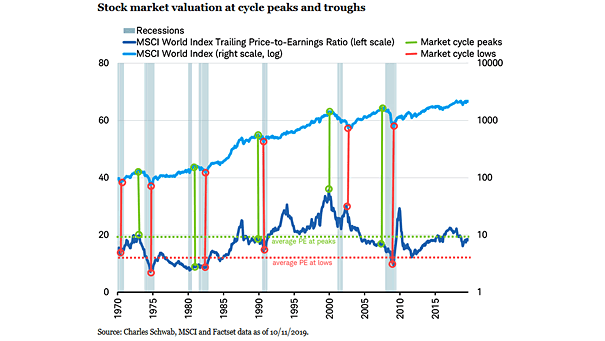
Relative Performance of MSCI World Factors
Relative Performance of MSCI World Factors In the last two weeks, the shift to value stocks may indicate that investors expect rates to rise. Image: Financial Times
Median MSCI World Index vs. Its Seasonal Pattern This chart shows when the median MSCI World Index tends to perform better or worse at certain times of the year. Image: J.P. Morgan
Japan Corporate Profits Leads MSCI World EPS This chart suggests that Japan corporate profits leads MSCI World EPS by 7 months. Image: Nordea and Macrobond
Global Manufacturing PMI and MSCI World Index The chart shows a pretty good correlation between Global Manufacturing PMI and the MSCI World Index. Stocks and PMI tend to move together. Image: Charles Schwab
MSCI All-Country World Index and RSI (14) Signs of overheating are emerging in global stocks, with technical and flow indicators nearing thresholds that have previously triggered sell signals. Image: Bloomberg
MSCI AC World Calendar Year Returns vs. Intra-Year Declines Despite median intra-year drops of 15%, the global equity index ended positively in 34 of the past 45 years—highlighting the value of long-term investing over reacting to short-term volatility. Image: Goldman Sachs Global Investment Research
MSCI AC World – Bear Market Rallies Since the 1980s, there have been 19 global bear market rallies, lasting 44 days on average with MSCI AC World returns of 10–15%. Image: Goldman Sachs Global Investment Research
MSCI Ex-US Developed World Stock Price Index Relative to MSCI US Stock Price Index vs. US Real Dollar Index There is often an inverse relationship between the U.S. dollar and international stock markets, meaning that a peak in the dollar could make international stocks more appealing to investors. Image: Paulsen Perspectives
Seasonality Trends in MSCI AC World Index (Global Equities) July has historically been a strong month for global equities, offering opportunities for investors to capture potential gains. Image: BofA Global Quantitative Strategy
Market Breadth – Percentage of MSCI AC World Stocks Above 200-Day Moving Average The decline in prices and selling pressure in April did not have a negative impact on the breadth of the market. Image: BofA Predictive Analytics
Equity – MSCI Japan Market Cap Relative to World Market Cap Considering the improved outlook, attractive valuations, and progress in corporate governance, should investors consider increasing their exposure to Japanese equities? Image: BofA Global Investment Strategy