Coronavirus – Equity Market Moves and Past Virus Outbreaks
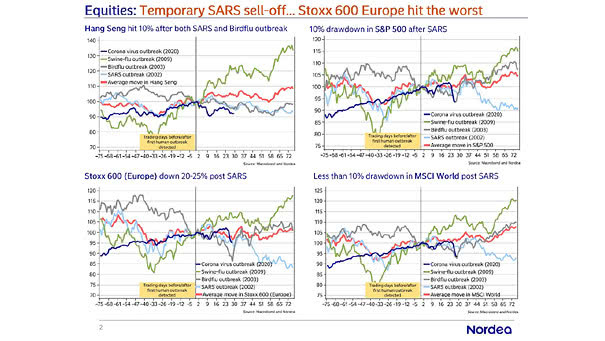
Coronavirus – Equity Market Moves and Past Virus Outbreaks The chart shows past virus outbreaks, highlighting the S&P 500, Stoxx 600, Hang Seng and MSCI World. Image: Nordea and Macrobond
Coronavirus – Equity Market Moves and Past Virus Outbreaks The chart shows past virus outbreaks, highlighting the S&P 500, Stoxx 600, Hang Seng and MSCI World. Image: Nordea and Macrobond
Performance – Value vs. Growth The U.S. market is experiencing outperformance in growth sectors driven by innovation and strong earnings, whereas value sectors dominate outside the U.S. due to slower earnings growth and differing economic dynamics. Image: Goldman Sachs Global Investment Research

S&P 500 Drawdown in DXY Dollar Index The U.S. equity drawdown has caused major losses for non-U.S. investors, as falling stock prices and a weaker dollar combined. This has prompted many to reconsider their currency risk strategies and exposure to U.S. equities. Image: Gavekal, Macrobond
Performance – Spread Between Quarterly Percentage Gains in S&P 500 Value and Growth Indexes Value stocks have significantly outperformed growth stocks in the first quarter of 2025. The upcoming earnings reports will play a pivotal role in determining whether this trend will persist or if growth stocks will reclaim their leadership. Image: Bloomberg