Dividends Yield on MSCI All Countries World Index (MSCI ACWI)
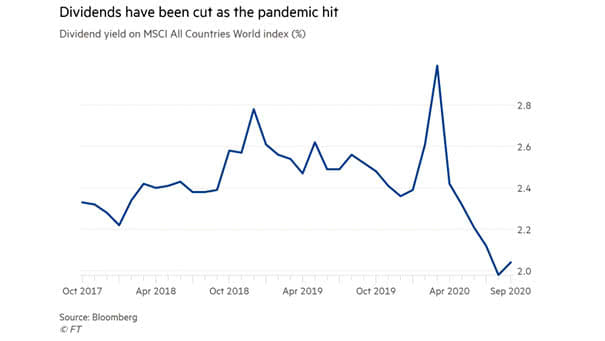
Dividends Yield on MSCI All Countries World Index (MSCI ACWI) Bye-bye dividends? Dividends have been hit hard by the coronavirus pandemic. Image: Financial Times
Dividends Yield on MSCI All Countries World Index (MSCI ACWI) Bye-bye dividends? Dividends have been hit hard by the coronavirus pandemic. Image: Financial Times
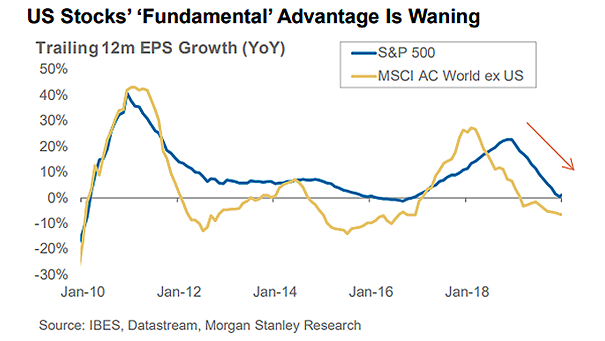
Trailing 12 Month EPS Growth: S&P 500 vs. MSCI AC World ex U.S. Chart suggesting that the “fundamental” advantage of U.S. stocks is diminishing. Image: Morgan Stanley Research

MSCI All Country World Index (ACWI) Dividend Yield Less U.S. 10-Year Yield When the spread has been greater than 1%, it has been a good support for the MSCI All Country World Index. Image: Exane BNP Paribas
MSCI All Country World Index (ACWI) – Period of Consolidation Exane is bullish and suggests that the MSCI ACWI might be nearing an end to this period of consolidation. Image: Exane BNP Paribas
MSCI All Country World Index (ACWI) Leads Global GDP This chart suggests that the MSCI All Country World Index (ACWI) leads Global GDP by 6 months. Image: Ken Fisher
MSCI Emerging Markets Index vs. World Semiconductor Sales This great chart suggests that world semiconductor sales lead the MSCI emerging markets index by 3 months. Very interesting chart before investing in emerging market equities. Country weights of the MSCI Emerging Markets Index: 33% China, 13.02% Korea, 11.35% Taiwan. Image: Nordea and Macrobond
Performance – S&P 500 Relative to Rest of the World While U.S. stocks outperformed international markets for more than a decade, 2025 has seen a reversal, with American equities lagging behind most global peers—even after the recent rally. Image: Bloomberg
MSCI ACWI Total Return Index – Rallies and Corrections Interesting chart showing the deviation of the MSCI AC World Total Return Index against its trend line, like the swing of a pendulum. Image: Fidelity Investments
Currency Impact on International Returns (MSCI ACWI ex-U.S.) Chart showing the currency impact on the MSCI All Country World ex-U.S. Index. Image: J.P. Morgan Asset Management
World Semiconductor Sales Lead Emerging Markets This chart suggests that world semiconductor sales lead the MSCI emerging markets index by 3 months. This is very interesting before investing in emerging market equities. Country weights of the MSCI Emerging Markets Index: 33% China, 13.02% Korea, 11.35% Taiwan. Image: Nordea and Macrobond
MSCI ACWI ex-U.S. and S&P 500 Index U.S. equities have significantly outperformed the rest of the world in recent years, but this has not always been the case. You may also like “Trailing 12-month Return Differential between U.S. and non-U.S. Stocks.” Image: ClearBridge Investments