Valuation – Ratio of Market Value to Total Revenues for Nasdaq 100 Index
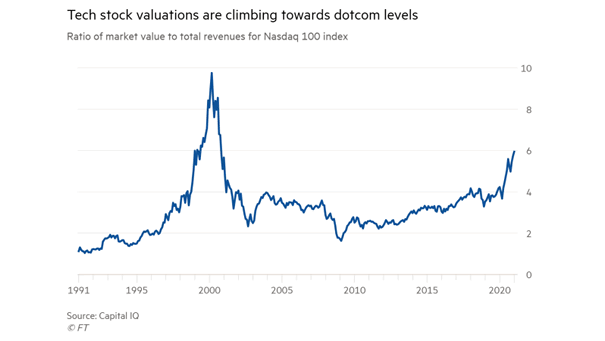
Valuation – Ratio of Market Value to Total Revenues for Nasdaq 100 Index How high can the Nasdaq 100 go? Image: Financial Times
Valuation – Ratio of Market Value to Total Revenues for Nasdaq 100 Index How high can the Nasdaq 100 go? Image: Financial Times
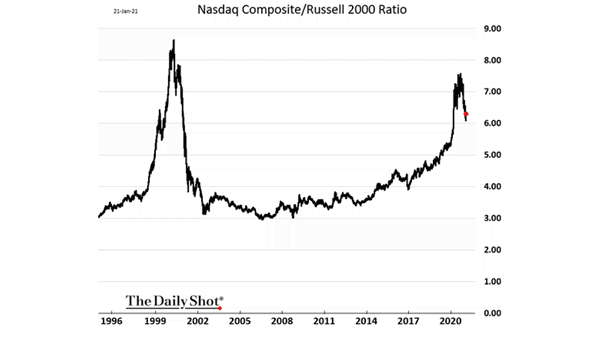
Nasdaq Composite/Russell 2000 Ratio Should investors expect the start of a long reversal? Image: The Daily Shot

Number of Nasdaq 100 Companies with 50% Returns Since 2010 Which companies in the Nasdaq 100 will be a good bet in 2021? Image: Bloomberg
Nasdaq 100 – U.S. S&P Tech / S&P 500 Has technology reached its peak after the massive run in 2020? Image: BCA Research
Russell 2000/Nasdaq 100 and Real U.S. 10-Year Yields This chart highlights the current divergence between real U.S. 10-year yields and the Russell 2000 relative to the Nasdaq 100. Image: Morgan Stanley Research
Nasdaq 100/Russell 2000 vs. Nasdaq 100/S&P 500 and CBOE Equity Put/Call Ratio Is Tech in a bubble? Image: Nordea and Macrobond
Performance – Nasdaq 100, Russell 2000, Stoxx Europe 600 Banks, MSCI All Countries Energy Welcome to the ‘everything rally’, despite the damage of the coronavirus pandemic on the global economy. Image: Financial Times
Nasdaq Composite to Russell 2000 Ratio Is it the start of a long reversal? Image: Deutsche Bank
Nasdaq 100 and 65-Day Rolling % Change Will the Nasdaq 100 keep setting records? Image: Strategas Research Partners
Cyclical Stocks – Russell 2000 / Nasdaq 100 and U.S. 10-Year Real Yields Chart suggesting that the stock rotation should continue as cyclical stocks perform better from higher interest rates and better growth. Image: Morgan Stanley Research
U.S. Election Blue Wave – Russell 2000 vs. Nasdaq 1000 Futures and U.S. 10-Year Treasury Yield The blue wave trades collapsed after President Trump’s victory in Florida. Image: BofA Research Investment Committee