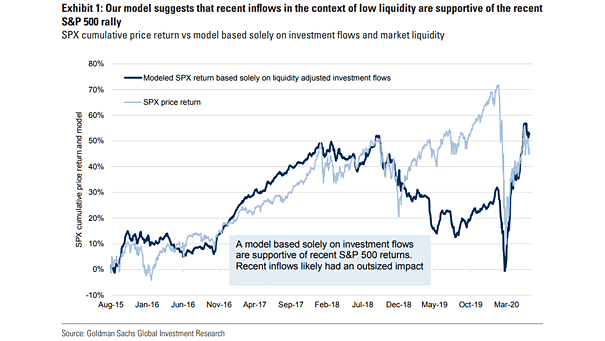
Cumulative Weekly Money Market Flows by Domicile
Cumulative Weekly Money Market Flows by Domicile Record money market flows in the United States, as the coronavirus pandemic leads to a flight to quality. Image: BofA Global Research
Global Cumulative Weekly Flow: Fixed Income vs. Equities This chart highlights once again investors’ strong preference for bonds. Image: BofA Global Research
Consolidated Equity Positioning and S&P 500 vs. Cumulative U.S. Equity Fund Flows Equity positioning continues to creep higher, but flows remain very defensive, as equities have seen outflows for the last three weeks. Image: Deutsche Bank Asset Allocation
Cumulative YTD Equity Sector Flows: Single Stock vs. ETF BofA clients bought ETFs and sold single stocks for the four week. Image: BofA Securities
Cumulative Bond Flows Since 2009 Flows into high-yield funds had been out of favor in this cycle. Is this good news? Image: Deutsche Bank Asset Allocation
U.S. Fund Flows Cumulative Since 2018 Fear of a recession has led to a record equity outflows and bond & cash inflows in recent years. Image: Goldman Sachs Global Investment Research
Cumulative Fund Flows into Global Equity Funds Institutional investors are back buying stocks. Image: J.P. Morgan
Cumulative U.S. Fund Flows since 2009 In terms of cumulative fund flows, this chart highlights the decade of U.S. bonds. Image: Fidelity Investments
Cumulative ETF Flows Flows into equities and bonds have been very steady since 2015. Image: Arbor Research & Trading LLC
Cumulative Weekly Fund Flows In terms of fund flows, this chart highlights the decade of fixed income. Image: BofA Global Research
Traditional 60/40 Portfolio and Percentage of Cumulative ETF Flows As suggested by this chart, the traditional 60/40 portfolio remains popular. Image: Arbor Research & Trading LLC