Traditional 60/40 Portfolio and Percentage of Cumulative ETF Flows
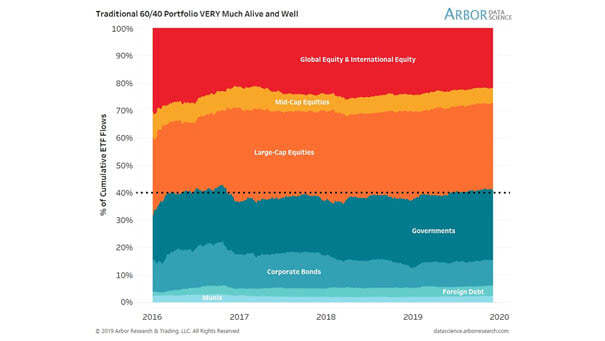
Traditional 60/40 Portfolio and Percentage of Cumulative ETF Flows As suggested by this chart, the traditional 60/40 portfolio remains popular. Image: Arbor Research & Trading LLC
Traditional 60/40 Portfolio and Percentage of Cumulative ETF Flows As suggested by this chart, the traditional 60/40 portfolio remains popular. Image: Arbor Research & Trading LLC
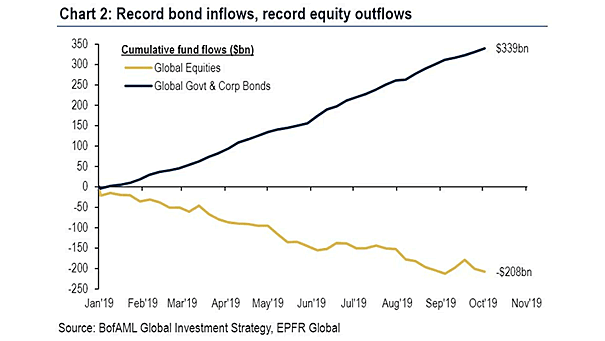
Cumulative Fund Flows: Global Equities and Global Government & Corporate Bonds $339 billion in inflows to bond funds globally, and $208 billion in outflows from global equity funds in 2019, as investors fear a global recession is on the horizon. Image: BofA Merrill Lynch

Cumulative Mutual Fund + ETF Flows by Bull Market Cycle: Bonds vs. Equities Flows Is this the most hated bull market in history? Well, investors continue buying bonds. Image: ICI Mutual & ETF Flow
S&P 500 vs. Cumulative Fund Flows “History never repeats itself but it rhymes” said Mark Twain. This chart shows the same trend as for the 2016 period. Image: Topdown Charts
Cumulative Net Flows into Passive and Active Equity Funds since 2005 Here is the cumulative net flows into passive and active equity funds from 2005 to 2019. Passive is indexes & ETFs. Until active equity funds drop fees, it will certainly continue.
Equity Sectoral and Regional ETF Flows Materials, energy and healthcare ETFs are still experiencing notable outflows, leading to a decrease in investor interest. Image: J.P. Morgan
Sector ETF Flows In 2024, the financial sector ETF (XLF) saw substantial inflows, making it the leading performer in attracting new capital, while the energy sector ETF (XLE) experienced significant outflows, ranking it as the worst performer. Image: GS Global Banking and Markets
U.S. Equity ETF Flows Inflows to U.S. equity ETFs as a percentage of S&P 500 market cap have reached elevated levels, reflecting strong investor confidence in U.S. equities. Image: J.P. Morgan Positioning Intelligence
Cumulative Net Buys of U.S. Equities by Pension Fund Clients Pension fund flows into U.S. equities have turned positive in 2H19. Image: BofA Merrill Lynch
Cumulative S&P 500 Buybacks 2009-2019 Are buybacks driving the show? Thanks to tax cuts and low interest rates, corporate stock buybacks are booming. Over the past decade, S&P 500 companies bought back $5 trillion shares, while cumulative flows from households and foreigners are only a drop in the bucket. But what would happend if companies reinvested instead…