Global Manufacturing Activity
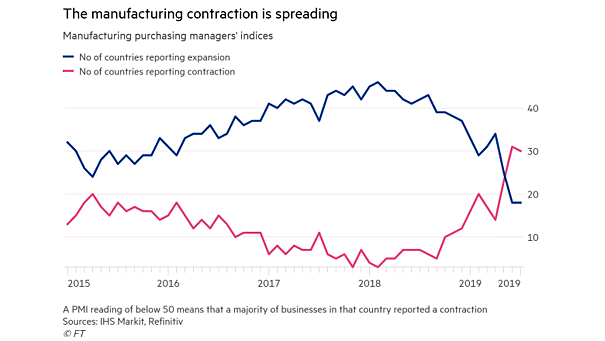
Global Manufacturing Activity The number of countries in contraction is higher than the number of countries in expansion. Image: Financial Times
Global Manufacturing Activity The number of countries in contraction is higher than the number of countries in expansion. Image: Financial Times
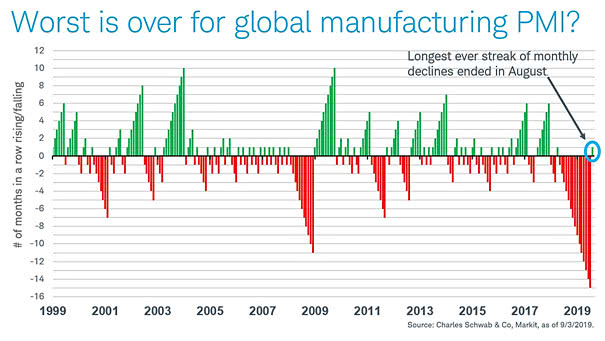
Global Manufacturing PMI This chart could suggest that the worst is over for global manufacturing after PMI ended 15 consecutive months of decline. Image: Charles Schwab

Global Manufacturing PMI and MSCI World Index The chart shows a pretty good correlation between Global Manufacturing PMI and the MSCI World Index. Stocks and PMI tend to move together. Image: Charles Schwab
Global Manufacturing PMI Leads Earnings The chart suggests that Global Manufacturing PMI leads earnings by 9 months. Image: Charles Schwab
Philadelphia Semiconductor Index (SOX) Leads Global Manufacturing PMI by Three Months This chart suggests that the rally in semiconductor stocks may herald a global growth rebound. Image: Oxford Economics, Macrobond
Global Real M1 Growth Leads Global Manufacturing PMI by around 6 Months When global real M1 money supply growth is very low, it does not bode well for global economic activity. Image: The Wall Street Journal
Global Manufacturing PMIs – USA vs. Rest of the World Global ex-US manufacturing PMI is below 50 (contraction). We will see if the United States can go it alone in the coming months. You may also like “ISM Manufacturing Index vs. S&P 500 Index since 2011“ Image: Topdown Charts
FMS Investors – Net % Say Global Profits Will Improve vs. ISM Manufacturing New Orders/Inventories There is a growing belief among FMS investors that global profits will improve in the future, which is encouraging. Image: BofA Global Fund Manager Survey
U.S. Dollar Index (DXY) vs. Manufacturing PMI (U.S. Minus Global Ex-U.S.) Will the U.S. dollar continue to weaken? Image: BCA Research
Interest Rates – Rate Hikes vs. Rate Cuts and Global PMI Manufacturing Global manufacturing PMI levels are screaming for policy tightening. Image: Nordea and Macrobond