Contribution to U.S. Real GDP by Sector
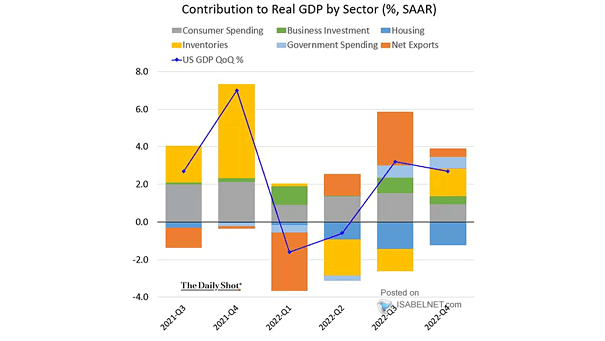
Contribution to U.S. Real GDP by Sector U.S. GDP grew 2.7% in Q4 2022. The housing slump was a net drag on GDP, and it’s not over yet. Image: The Daily Shot
Contribution to U.S. Real GDP by Sector U.S. GDP grew 2.7% in Q4 2022. The housing slump was a net drag on GDP, and it’s not over yet. Image: The Daily Shot
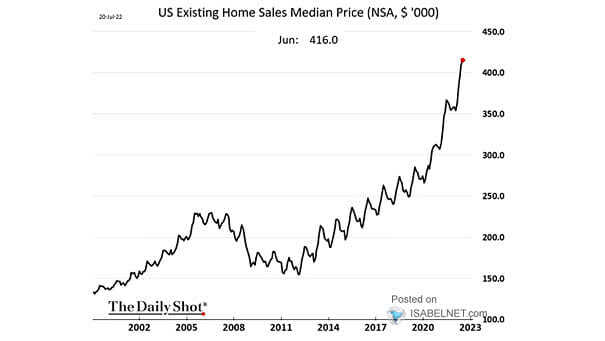
Housing – U.S. Existing Homes Sales U.S. home prices don’t go up forever. Image: The Daily Shot

Fed MBS Holdings and FHFA House Price Index Despite a strong U.S. housing market, the Federal Reserve continues to buy mortgage-backed securities (MBS). Image: BofA Global Investment Strategy
Bubble – U.S. Existing House Price Divided by Median Family Income Are Americans trapped in another housing bubble? Image: Evercore ISI
S&P 500 Year-Over-Year Return Explained Chart suggesting that strong housing and jobs growth explain S&P 500 returns. Image: Arbor Research & Trading LLC
Are Fears About an Imminent Recession Overblown? Historically, a recession is coming when the Leading Index for the United States is below 1. Today, it stands at 1.37. “The leading index for each state predicts the six-month growth rate of the state’s coincident index. In addition to the coincident index, the models include other variables…
U.S. Inflation since 2000 U.S. households are more concerned about the rising cost of medical care and housing, than overall inflation. Image: Financial Times
Median Age of All U.S. Homebuyers Housing affordability is difficult today. The median age of all U.S. homebuyers hit a record, rising from 31 years in 1981 to 47 years in 2019. Image: Deutsche Bank Global Research
Homeownership Disparity Deepens Since 1994, the gap between blacks and whites has widened, in part because starter-home prices have exploded, year after year. Inequality: you may also like “U.S. Unemployment Rate: Black or African Americans” and “U.S. Net Worth by Wealth Bracket” and “Countries With the Highest Housing Bubble Risks.” Picture Source: Bloomberg
Home Builder Sentiment Leads Consumer Spending Interesting chart suggesting that the NAHB housing market index leads the change in consumer spending. The latest reading for July suggests that the outlook for the U.S. economy is expected to slow. Image: Dr Thomas Kevin Swift
Are We Near a Recession? “The leading index for each state predicts the six-month growth rate of the state’s coincident index. In addition to the coincident index, the models include other variables that lead the economy: state-level housing permits (1 to 4 units), state initial unemployment insurance claims, delivery times from the Institute for Supply…