Range of Returns Two Years After Fed Rate Cut
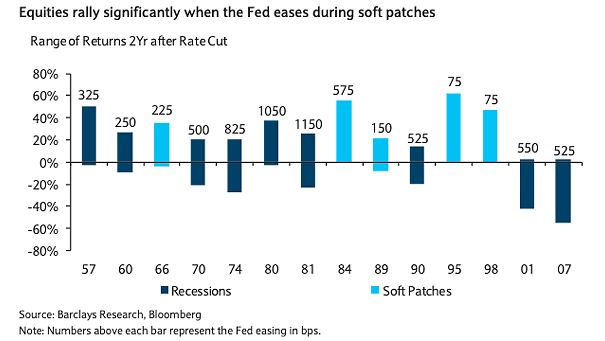
Range of Returns Two Years After Fed Rate Cut Historically, equities rally significally, when the Fed eases during soft patches. Image: Barclays Research
Range of Returns Two Years After Fed Rate Cut Historically, equities rally significally, when the Fed eases during soft patches. Image: Barclays Research
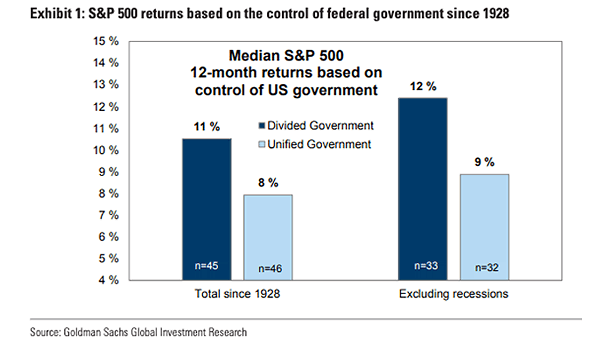
Median S&P 500 12-Month Returns Based on Control of U.S. Government A unified government under the Democrats could represent a major risk for the S&P 500 in 2020. Image: Goldman Sachs Global Investment Research

Russell 2000 Returns After New 52-Week Highs After more than a year without a new 52-week high, the Russell 2000 has been higher 12 months later 10 of 11 times and up 17% on average. Image: Ryan Detrick, LPL Financial LLC
S&P 500 Normalized P/E vs. Subsequent Annualized Returns Chart suggesting annual returns of around 5% over the next 10 years (R² = 0.79). Image: BofA Merrill Lynch US Equity & US Quant Strategy
S&P 500 Index Average Returns After Record Highs Since 1950, the S&P 500 has continued to reach record highs, but rarely in a straight line. Image: LPL Research
S&P 500 Return A Year Later Off The Midterm Election Lows A year after the midterm lows, the S&P 500 is up 32% on average. History also shows that the S&P 500 has been higher 17 out of the last 17 times, since 1950. Image: Ryan Detrick, LPL Financial LLC
S&P 500 Total Return, Adjusted for Inflation, in Three Years After Initial Election The stock market performance, adjusted for inflation, in first three years since Trump’s election is quite good. Image: Bloomberg
Baseline Equity Returns (5 Years) Chart suggesting that high market valuations will affect equity returns in the coming years. Image: Oxford Economics
Distribution of U.S. Market Returns Since 1926, annual returns between 20% and 30% are the most common. Year-to-date, the S&P 500 Index has gained 23%. Image: Center of Research in Security Prices
S&P 500 First Week of November to Year-End Return Interesting chart suggesting that the return from 11/5 to the end of this year could be around 4%, and the S&P 500 Index above 3,200. Image: Fundstrat Global Advisors, LLC
Outlook for Portfolio Returns Over the Next 10 Years Chart suggesting anemic returns over the next 10 years, due to low yields, low growth and low inflation expectations. Image: Morgan Stanley Research