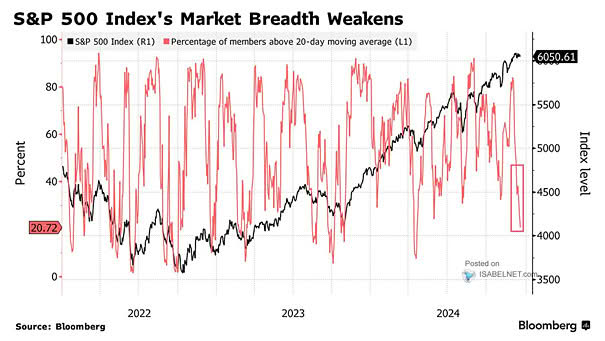
S&P 500 and Stocks Above Their 20-Day Moving Average
S&P 500 and Stocks Above Their 20-Day Moving Average With only a small percentage of U.S. stocks trading above their 20-day moving average in a bull market, the S&P 500 index appears oversold, potentially signaling buying opportunities for investors Image: Bloomberg