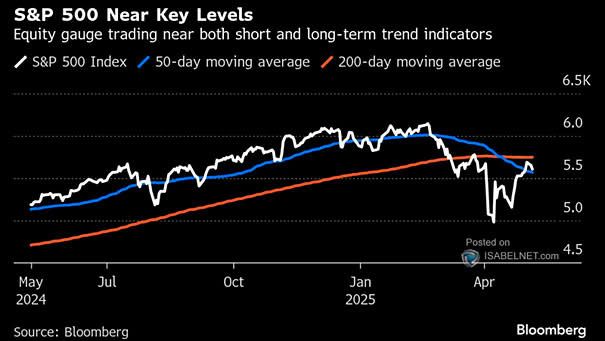
S&P 500 Performance After >58% of Components Make a New 20-Day High

S&P 500 Performance After >58% of Components Make a New 20-Day High More good news for bulls: Since 1976, the S&P 500 has gained an average of 18.7% in the 12 months after more than 58% of its components hit a 20-day high, with positive returns every single time. Image: Carson Investment Research

S&P 500 and % of Stocks at 20-Day High

S&P 500 Performance After >55% of Components Make a 20-Day High There’s good news for bulls: since 1970, the S&P 500 has gained an average of 16.3% in the 12 months after more than 55% of its components hit a 20-day high, with positive returns occurring 96.7% of the time. Image: Carson Investment Research

S&P 500 Quarterly Earnings

S&P 500 Quarterly Earnings S&P 500 earnings growth in Q1 2025 was robust. Although earlier forecasts anticipated slower growth, actual results surpassed expectations, showing only a mild deceleration while maintaining double-digit gains. Image: Deutsche Bank Asset Allocation

S&P 500 Performance Recovering 50% of Bear Market

S&P 500 Performance Recovering 50% of Bear Market With the S&P 500 regaining half of its near-bear market losses in 2025, history strongly suggests that the lows may already be behind us. Since 1950, the S&P 500 has always produced positive returns one year later. Image: Carson Investment Research

S&P 500 Performance When There is a 6-Day Win Streak During a Calendar Year

S&P 500 Performance When There is a 6-Day Win Streak During a Calendar Year Bulls once again have reason to smile: a six-day S&P 500 winning streak has preceded positive annual performance in 15 out of 16 years since 2005, with 2018 being the only exception. Image: Carson Investment Research

S&P 500 Performance After >70% Advancers Three Days in a Row on the NYSE

S&P 500 Performance After >70% Advancers Three Days in a Row on the NYSE Historically, three consecutive days with over 70% NYSE advancers signal strong bullish momentum. Since 1950, the S&P 500 has delivered positive 12-month returns 96% of the time, averaging an 18.9% gain. Image: Carson Investment Research

S&P 500 and Zweig Breadth Thrust

S&P 500 and Zweig Breadth Thrust Bulls have reason to smile as the Zweig Breadth Thrust has perfectly predicted S&P 500 gains in all 19 post-WWII instances, averaging 23.4% returns within a year and never producing losses over 6- or 12-month horizons. Image: Carson Investment Research

S&P 500 and NYSE >70% Advancers Six Times Over a Two Weeks Period

S&P 500 and NYSE >70% Advancers Six Times Over a Two Weeks Period Six trading days with NYSE advancers exceeding 70% within a two-week period historically signal a robust bullish phase—distinct from bear-market rallies—with an average 12-month S&P 500 gain of 22.6% since 1950. Image: Carson Investment Research

S&P 500 and NYSE >89% Advancers and >89% Advancing Volume in Nine Days

S&P 500 and NYSE >89% Advancers and >89% Advancing Volume in Nine Days A rare event—over 89% of NYSE stocks and volume advancing twice in nine days—has historically signaled strong bullish momentum. Since 1980, the S&P 500 was positive 100% of the time over the next year, with a median 35% gain. Image: Carson Investment…

Huge Advancing Volume as a % of Total Volume and What the S&P 500 Did Next

Huge Advancing Volume as a % of Total Volume and What the S&P 500 Did Next NYSE’s surging advancing volume on Wednesday is highly bullish, with historical data since 1980 showing the S&P 500 consistently gaining over 3-, 6-, and 12-month periods afterward, averaging a 29.2% annual return. Image: Carson Investment Research

S&P 500 Daily % Range

S&P 500 Daily % Range The S&P 500 surged 9.52% on Wednesday, its third-largest single-day gain since WWII, with an intraday range of 10.77%. Image: The Daily Shot