S&P 500 Daily % Range
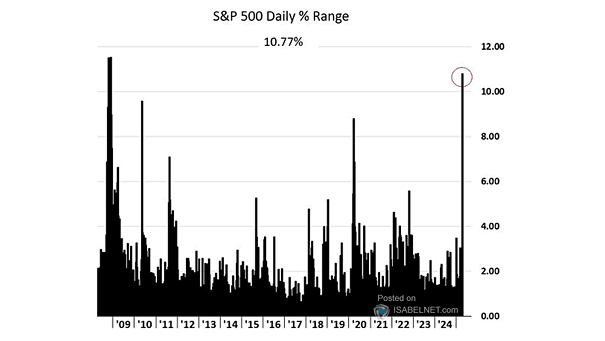
S&P 500 Daily % Range The S&P 500 surged 9.52% on Wednesday, its third-largest single-day gain since WWII, with an intraday range of 10.77%. Image: The Daily Shot
S&P 500 Daily % Range The S&P 500 surged 9.52% on Wednesday, its third-largest single-day gain since WWII, with an intraday range of 10.77%. Image: The Daily Shot
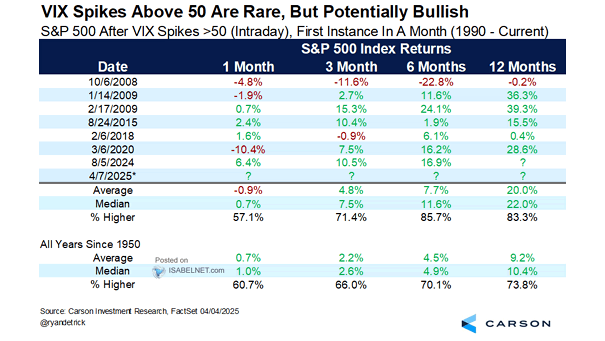
S&P 500 After VIX Spikes >50 (Intraday), First Instance in a Month An intraday VIX spike to 50, often triggered by panic-driven market declines, typically signals a recovery ahead. Historically, the S&P 500 has gained an average of 20% in the year following such events. Image: Carson Investment Research

S&P 500 Average Monthly Return Above and Below 200-Day Moving Average Historically, the S&P 500 has performed well in April, averaging gains of over 2% since 1950 when starting below its 200-day moving average. Image: Oppenheimer & Co. Inc. and Bloomberg
S&P 500 vs. 10-Year U.S. Treasury Yield The S&P 500 has fallen about 5% in the past month, but 10-year U.S. Treasury yields haven’t changed much. This unusual pattern suggests that Treasuries might be losing some of their effectiveness as a hedge against stock market declines. Image: Deutsche Bank
Performance – S&P 500 vs. Stoxx Europe 600 European stocks are delivering robust gains relative to the U.S. this quarter, but sustaining this momentum through year-end remains uncertain given past trends. Image: Bloomberg
S&P 500 Index Max Pullback per Calendar Year Corrections can be unsettling for investors but don’t always signal a more severe downturn. Since 1980, the S&P 500 has had 16 corrections that didn’t lead to bear markets, resulting in an average gain of 9.5% for those years. Image: Carson Investment Research
S&P 500 Performance During Government Shutdowns While government shutdowns can create short-term volatility, historical data shows that the S&P 500 has gained an average of 12.7% in the 12 months after such events, with positive returns occurring 86.4% of the time. Image: Carson Investment Research
S&P 500 Performance After Five Consecutive Days of a 1% Daily Move and All Above the 200-Day MA Historically, when the S&P 500 has experienced five consecutive days of 1% moves while remaining above its 200-day MA, it has performed well over the following six months, averaging an 11.0% gain and rising 91.7% of the…
S&P 500 Performance When Higher in January and Lower in February Since 1950, when the S&P 500 has a positive January followed by a negative February, the index tends to finish the year strong, resulting in gains 75% of the time, with a median increase of 10.1% – better than the average year. Image: Carson…
DAX vs. S&P 500 Despite the German economy contracting for the second consecutive year, the DAX has shown impressive performance, highlighting the disconnect between stock market gains and economic realities. Image: Goldman Sachs Global Investment Research
S&P 500 vs. Margin Debt Margin debt boosts market gains as investors leverage their positions to increase buying power. A reliable warning sign for reducing portfolio risk occurs when margin balances drop below the 12-month moving average. Image: Real Investment Advice