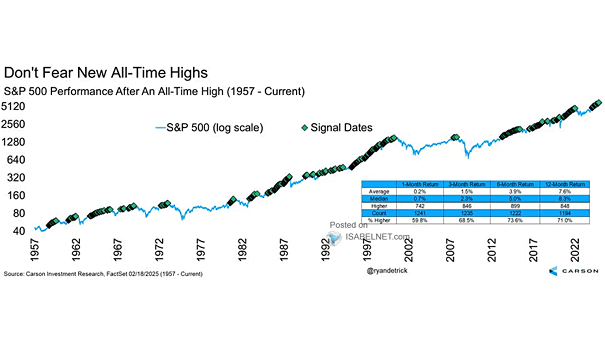
U.S. Small Caps – Ratio of Russell 2000 vs. S&P 500
U.S. Small Caps – Ratio of Russell 2000 vs. S&P 500 Chart suggesting that small stocks are no longer providing big gains for investors Image: Financial Times
Performance – FANG+ Index vs. S&P 500 and U.S. Banks The FANG+ index climbs higher, while banks slump again over fears of job losses and bad loans. Image: J.P. Morgan
Gold vs. S&P 500 and Inflation Gold is considered to be a hedge against inflation and tends to outperform equities in environments when inflation gets above trend. Image: Goldman Sachs Global Investment Research
S&P 500 – Top Months Since World War II The S&P 500 posted its biggest one-month gain since 1987, surging 12.7% in April. Image: CNBC
S&P 500 and Best 15-Day Returns Ever Historically, the best 15-day returns ever have lead to strong returns over the next 12 months, with an average gain of 21.9%. Image: LPL Research
S&P 500 and Number of Days in the Past 7 Weeks More Than +/- 3% The S&P 500 has moved more than +/- 3% during 22 days in the past 7 weeks. In October 1932 and November 2008, the S&P 500 gained +40% and +27% over the next year. Image: Sentimentrader
S&P 500 – Anatomy of a Decline Is this a new bull market? Not yet, although the S&P500 has gained 20% from the low of 2192. Image: Fidelity Investments
S&P 500 Performance When President Is Up For Reelection Since 1950, the S&P 500 has finished the year higher when a President has been up for reelection. Gains tend to occur in the second half of the year. Image: Ryan Detrick, LPL Financial LLC
Annual Performance of S&P 500 The S&P 500 Index gained 29% in 2019, its best performance since 2013, boosted by economic data, Fed rate cuts, and the US-China phase-one trade deal. Image: Credit Suisse Research
Average 12-Month Forward S&P 500 Returns by Equity Risk Premium Tranche According to the chart, the current equity risk premium suggests strong gains in the S&P 500 over the next 12 months. Image: Truist