GWIM Flows to Cash 4WMA
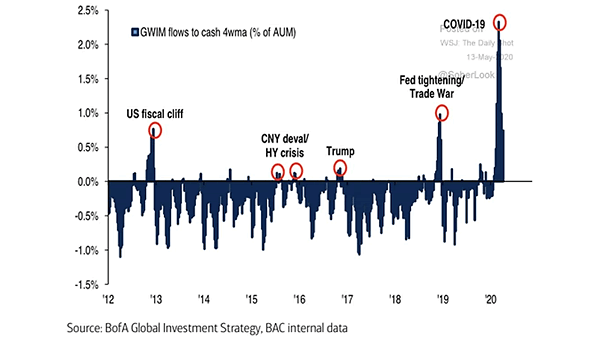
GWIM Flows to Cash 4WMA BofA private clients have raised record amounts of cash amid uncertainty in the global economy. Image: BofA Global Investment Strategy
GWIM Flows to Cash 4WMA BofA private clients have raised record amounts of cash amid uncertainty in the global economy. Image: BofA Global Investment Strategy
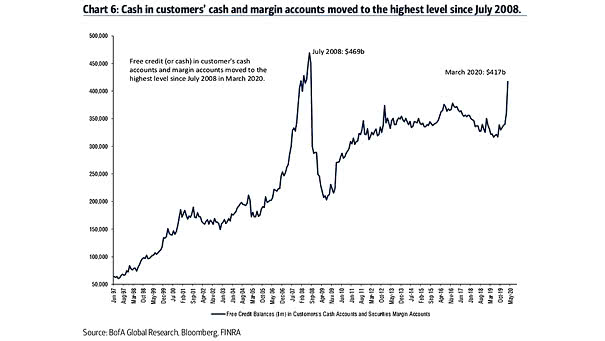
Free Credit Balances in Customers’s Cash Accounts and Securities Margin Accounts Cash levels in customers cash and margin accounts surged to the highest level since July 2008. Image: BofA Global Research

Cash – Money-Market Fund Assets Morgan Stanley’s wealth clients moved away from stocks into cash. Image: Bloomberg
FMS Cash Balance vs. S&P 500 The BofA Fund Manager Survey cash balance jumps to 5.9%, highest since right after 9/11. This is an interesting contrarian indicator. Image: BofA Global FMS
WTI Spot Oil Price and Cash Floor The chart suggests that there is a risk that oil prices move to cash costs. Image: Goldman Sachs Global Investment Research
ISM Manufacturing Index vs. S&P 500 Cash Flow Chart showing the correlation between S&P 500 cash flow and the ISM Manufacturing Index. Image: Raoul Pal
Performance vs. S&P 500 by Uses of Cash S&P 500 companies using cash for mergers and acquisitions have outperformed since December 2017. Image: Goldman Sachs Global Investment Research
Cash – Banknotes and Coins in Circulation as a Percentage of GDP This chart suggests that negative interest rates can increase the demand for cash. Image: Deutsche Bank Global Research
Fund Manager Survey Cash Balance BofA Fund Manager Survey cash levels hold to 4.2%, the lowest cash balance since March 2013. Image: BofA Merrill Lynch Global Fund Manager Survey
Equity Yields vs. Bond Yields vs. Cash Yields Chart showing the large gap in yields between equities, bonds and cash. Image: J.P. Morgan
U.S. Equity Fund Flows vs. Bonds and Cash This chart puts into perspective the rotation from equities to bonds and cash, as investors become cautious about further growth. Image: Goldman Sachs Global Investment Research