U.S. Equity Fund Flows vs. Bonds and Cash

U.S. Equity Fund Flows vs. Bonds and Cash This chart puts into perspective the rotation from equities to bonds and cash, as investors become cautious about further growth. Image: Goldman Sachs Global Investment Research

S&P 500 Cash Balances and Debt Levels

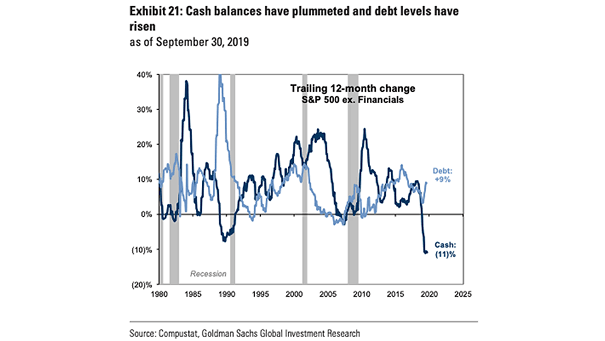
S&P 500 Cash Balances and Debt Levels During the past 12 months, non-financial S&P 500 cash balances have declined by -11% and debt levels have inflected higher by +9%. Image: Goldman Sachs Global Investment Research

S&P 500 Cash Spending

S&P 500 Cash Spending According to Goldman Sachs, cash spending by S&P 500 companies is likely to fall by 6% in 2019, the largest year-over-year decline since 2009. Image: Goldman Sachs Global Investment Research

Shareholder Return vs. Free Cash Flow

Shareholder Return vs. Free Cash Flow Thanks to low interest rates, shareholder return has exceeded free cash flow levels again. U.S. companies cannot spend more than they earn indefinitely. Image: Goldman Sachs Global Investment Research

Dividends and Buybacks vs. Free Cash Flow

Dividends and Buybacks vs. Free Cash Flow Dividends and buybacks have exceeded free cash flow levels again, thanks to low interest rates. But companies cannot spend more than they earn forever. Image: Capital Group

Cash in Circulation in Various Countries

Cash in Circulation in Various Countries The use of cash has decreased significantly in Sweden. The first cashless society? Image: Nordea and Macrobond

S&P 500 Use of Cash and Buybacks

S&P 500 Use of Cash and Buybacks This chart shows that buybacks account for the largest share of cash spending by companies in the S&P 500. Image: Goldman Sachs Global Investment Research

Allocation to Cash and Recession Probability

Allocation to Cash and Recession Probability This chart shows the correlation between allocation to cash and the NY Fed 12-month ahead recession probability indicator. Image: Barclays Research

S&P 500 Cash Return Yield by Sector and Region

S&P 500 Cash Return Yield by Sector and Region Currently, the S&P 500 cash return yield (buybacks + dividends) is 5.2%, the highest since 2011. That’s much more than Europe, Japan and emerging markets. Image: Fundstrat Global Advisors, LLC