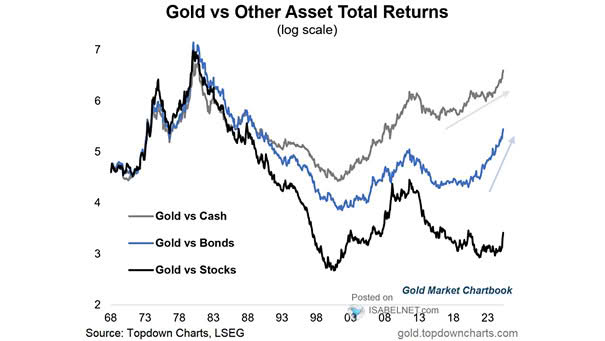
Gold vs. Other Asset Total Returns
Gold vs. Other Asset Total Returns A performance rotation from stocks to gold is emerging. This may signal the beginning of a broader shift, as Trump’s efforts to weaken the dollar and lower rates coincide with a deteriorating outlook for equities. Image: Topdown Charts