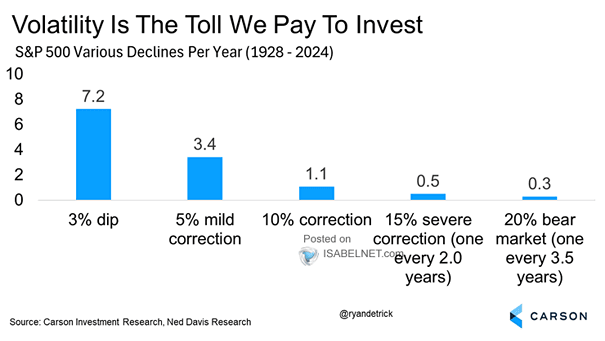
S&P 500 Various Declines per Year
S&P 500 Various Declines per Year Market fluctuations are normal in investing, so effectively understanding and managing volatility is crucial for investors aiming to achieve favorable returns in financial markets. Image: Carson Investment Research