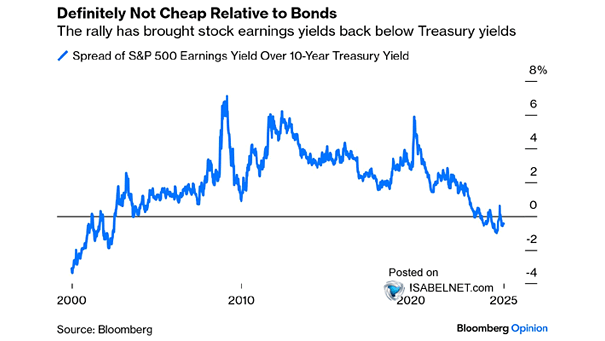
S&P 500 Earnings Yield Minus U.S. 10-Year Treasury Yield
S&P 500 Earnings Yield Minus U.S. 10-Year Treasury Yield The recent rally has made U.S. equities relatively expensive compared to bonds. Historically, when the risk premium has been at current levels, the S&P 500 has delivered an average 12-month return of only 2.5% over the past three decades. Image: Bloomberg