MSCI AC World – Bear Market Rallies
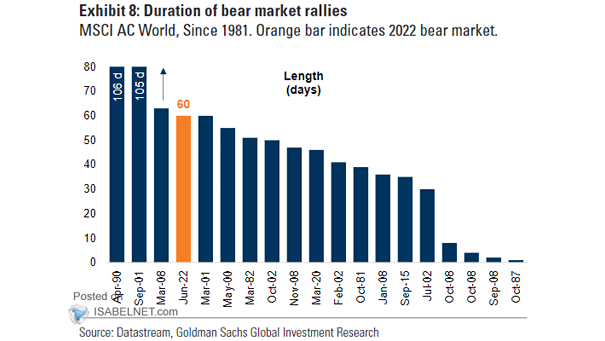
MSCI AC World – Bear Market Rallies Since the 1980s, there have been 19 global bear market rallies, lasting 44 days on average with MSCI AC World returns of 10–15%. Image: Goldman Sachs Global Investment Research
MSCI AC World – Bear Market Rallies Since the 1980s, there have been 19 global bear market rallies, lasting 44 days on average with MSCI AC World returns of 10–15%. Image: Goldman Sachs Global Investment Research
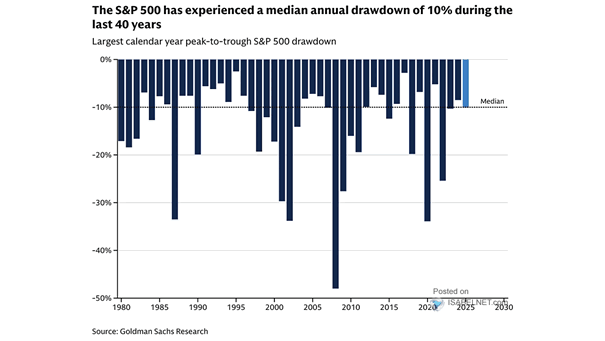
Largest Calendar Year Peak to Trough S&P 500 Drawdown The S&P 500 has shown resilience over extended periods, often delivering positive annual returns despite experiencing significant intra-year volatility. Over the past 40 years, the median annual drawdown of the index has been 10%. Image: Goldman Sachs Global Investment Research

Trade Policy Uncertainty Indexes Uncertainty in trade policy often leads to positive future returns for the S&P 500, as markets tend to price in worst-case scenarios during unclear times. Once clarity emerges, stocks frequently recover. Image: Deutsche Bank
U.S. Economic Policy Uncertainty Index Uncertainty in economic policy has often led to positive future returns for the S&P 500, as markets anticipate the worst during unclear periods. When the situation becomes clearer, stocks tend to recover strongly. Image: Goldman Sachs Global Investment Research
S&P 500 Performance After AAII Bears Above 50% Five Straight Weeks Historically, when bearish sentiment in the AAII poll surpasses 50% for five straight weeks, U.S. stocks have shown an average return of 21% over the next 12 months, with positive returns occurring 100% of the time since 1990. Image: Carson Investment Research
S&P 500 Performance After Two 90% Advancing Issues in a Row Since 1980, two consecutive days with 90% advancing issues in the S&P 500 have delivered a median return of 16.5% over the following 12 months, with positive returns occurring 90.9% of the time—giving bulls reason to rejoice! Image: Carson Investment Research
Periods of S&P 500 Correction Above 10% Due to the U.S. stock market’s dominant position, a correction exceeding 10% frequently triggers a domino effect across global equity markets, as investors react to heightened uncertainty and risk aversion. Image: Goldman Sachs Global Investment Research
S&P 500 Performance After Enters a 10% Correction, But Doesn’t Go into a Bear Market Historically, when the S&P 500 falls 10% without entering a bear market, it’s a potential buying opportunity. Since 1950, it has always been higher 6 and 12 months later, with a median 12-month return of 15.2%. Image: Carson Investment Research
S&P 500 Valuations Valuations don’t matter—until they do. Prolonged periods of high valuations can lead to lower future returns, so investors should approach them with caution. Image: Topdown Charts
Average Year for the S&P 500 the Past 20 Years Bulls have reason to smile, as March 12 has marked notable market bottoms for U.S. stocks over the past two decades, and from that point, things tend to improve significantly. “History doesn’t repeat itself, but it often rhymes.” Image: Carson Investment Research
The Worst Day of the Year for the S&P 500 When It Gains >20% for the Year Monday saw the S&P 500 drop 2.7%, its worst day this year. Even in years with strong returns over 20%, single-day losses average 3.5% since 1950. Sharp daily declines are often part of significant annual gains. Image: Carson…