Inflation – Tariff Implementation Period
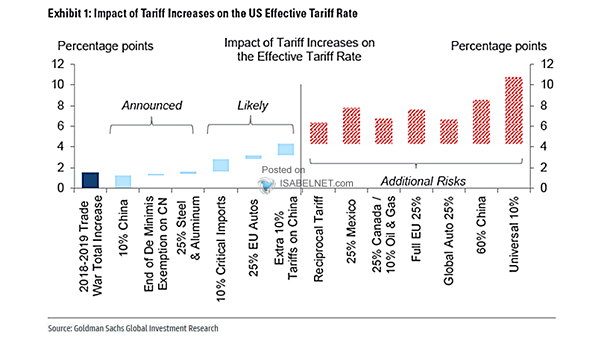
Inflation – Tariff Implementation Period Is it time to lift Trump administration’s tariffs to ease U.S. inflation? Image: Goldman Sachs Global Investment Research
Inflation – Tariff Implementation Period Is it time to lift Trump administration’s tariffs to ease U.S. inflation? Image: Goldman Sachs Global Investment Research
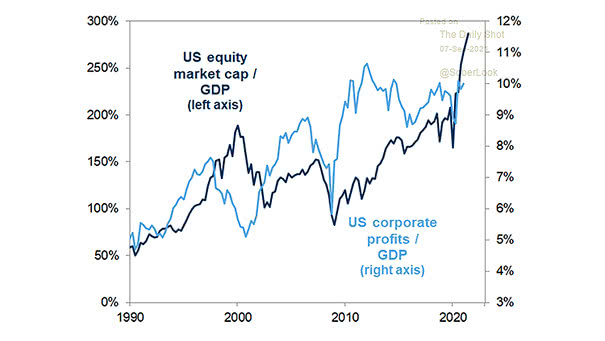
Valuation – U.S. Equity Market Cap to GDP and U.S. Corporate Profits to GDP Is the U.S. stock market expensive? The U.S. equity market capitalization to GDP ratio hits a new all-time high. Image: Goldman Sachs Global Investment Research

Household Debt Outstanding as a Percentage of Annual GDP Household debt to GDP ratios decreased in the recent years. Image: Goldman Sachs Global Investment Research
Market Capitalization of FAAMG Stocks as % of S&P 500 This chart highlights the record concentration of market cap in FAAMG stocks. Image: Goldman Sachs Global Investment Research
Market Capitalization – Five Largest Companies as Share of S&P 500 Total This chart highlights the record concentration of market cap in the five largest stocks. Image: Goldman Sachs Global Investment Research
Market Capitalization of Largest Companies as Share of S&P 500 Total Chart showing the record level of concentration in the U.S. equity market. Image: Goldman Sachs Global Investment Research
Market Capitalization of the Largest 10 Companies as a % of the Index Market Capitalization This charts highlights the high concentration of market capitalization in the largest 10 companies. Image: Goldman Sachs Global Investment Research
Global Growth and U.S. vs. Emerging Markets Differential The U.S. has led in several periods of global growth acceleration since 2010. Image: Goldman Sachs Global Investment Research
U.S. Cyclicals vs. Defensives It’s all about sector rotation: the cyclicals vs. defensives trade is now pricing a growth acceleration. Image: Goldman Sachs Global Investment Research
History of Oil Prices Since 1861 This chart is a good illustration of oil price volatility over time. Image: Goldman Sachs Global Investment Research