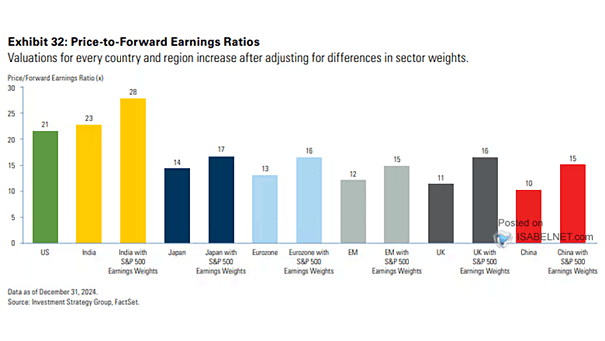
Valuation – Nasdaq 100 Fwd P/E
Valuation – Nasdaq 100 Fwd P/E Tech stocks are priced at a premium, with forward valuations significantly above their 10-year average. This rich valuation assumes technology companies will maintain their earnings leadership. Image: Bloomberg