Why a Low or Negative Equity Risk Premium Coincides with a Temporary Market Peak?

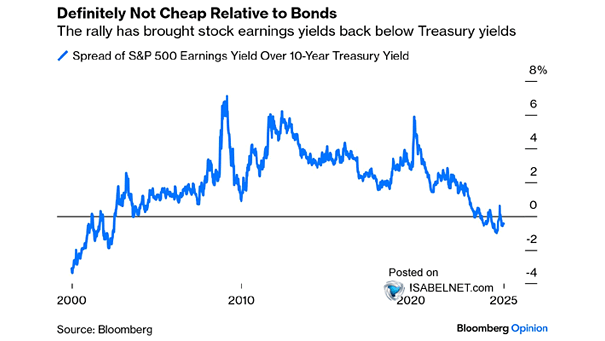
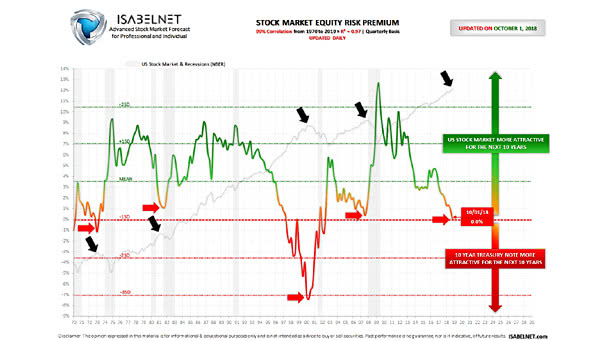
Why a Low or Negative Equity Risk Premium Coincides with a Temporary Market Peak? Because it pushes investors into bonds rather than equities. This was the case in 1973, 1981, 2000, 2007 and 2018 before the market crash. The current equity risk premium is available to our subscribers. Our equity risk premium model has a great 96% correlation with…

Stock Market Equity Risk Premium

https://www.isabelnet.com/wp-content/uploads/2019/03/stock-market-equity-risk-premium.mp4 This fabulous model shows if the US stock market return for the next 10 years is more or less attractive than the 10-Year Treasury Note The US stock market equity risk premium is the US stock market excess return for the next 10 years over the US 10-year Treasury Note. This is the premium…

Premium Membership

PREMIUM MEMBERSHIP – Click the Images to Enlarge Video tutorials are available by clicking on this link: “FORECASTING MODELS” located in the menu bar at the top of each page. Our daily Stock Market Bull and Bear Indicator is available in the Pro Membership. Upgrade your Premium Membership to a Pro Membership Now! The period of…

Premium Membership Subscription

PREMIUM MEMBERSHIP SUBSCRIPTION 29.95€/mo 299€/year and save 15% single user 3 Forecasting Models Stock Market Valuation Stock Market Short-Term Forecast Stock Market Equity Risk Premium

S&P 500 Valuations

S&P 500 Valuations The composite S&P 500 valuation indicator—which integrates PE ratios, equity risk premia, and price-based mean reversion factors—has recently reset to a level close to neutral, which is an encouraging sign. Image: Topdown Charts

Valuation – Consensus Forward P/E vs. Expected EPS Growth

Valuation – Consensus Forward P/E vs. Expected EPS Growth The P/E premium reflects higher expected EPS growth, supported by a strong current correlation between EPS growth forecasts and P/E multiples. Image: Goldman Sachs Global Investment Research

Sensitivity of S&P 500 Returns to EPS and P/E Scenario

Sensitivity of S&P 500 Returns to EPS and P/E Scenario Goldman Sachs projects S&P 500 EPS at $253 for 2025, driven by economic slowdowns, tariff pressures, and inflationary risks. Image: Goldman Sachs Global Investment Research

Valuation – Nasdaq 100 Fwd P/E

Valuation – Nasdaq 100 Fwd P/E Tech stocks are priced at a premium, with forward valuations significantly above their 10-year average. This rich valuation assumes technology companies will maintain their earnings leadership. Image: Bloomberg

Valuation – Price-to-Forward Earnings Ratios

Valuation – Price-to-Forward Earnings Ratios The U.S. stock market maintains a premium valuation compared to global markets, with the exception of India, leaving little room for error as it’s priced for perfection. Image: Goldman Sachs Global Investment Research

Valuation – Forward 12-Month P/E for S&P 500

Valuation – Forward 12-Month P/E for S&P 500 While U.S. equities are trading at a premium to global stocks, this situation reflects both the strength of the U.S. market and economy. But there are potential risks associated with high valuations and market concentration. Image: Bloomberg

S&P 500 vs. S&P 500 Equal-Weight

S&P 500 vs. S&P 500 Equal-Weight The S&P 500 cap-weighted index return premium has reached extreme levels. Should investors now favor the S&P 500 equal-weighted index over the cap-weighted index? Image: Morgan Stanley Wealth Management