For Professionals and Individuals

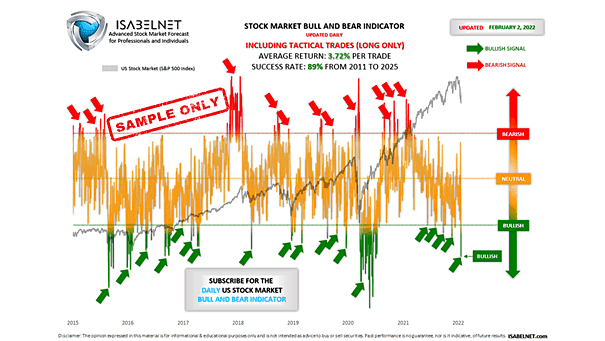
U.S. Stock Market Bull and Bear Indicator – S&P 500
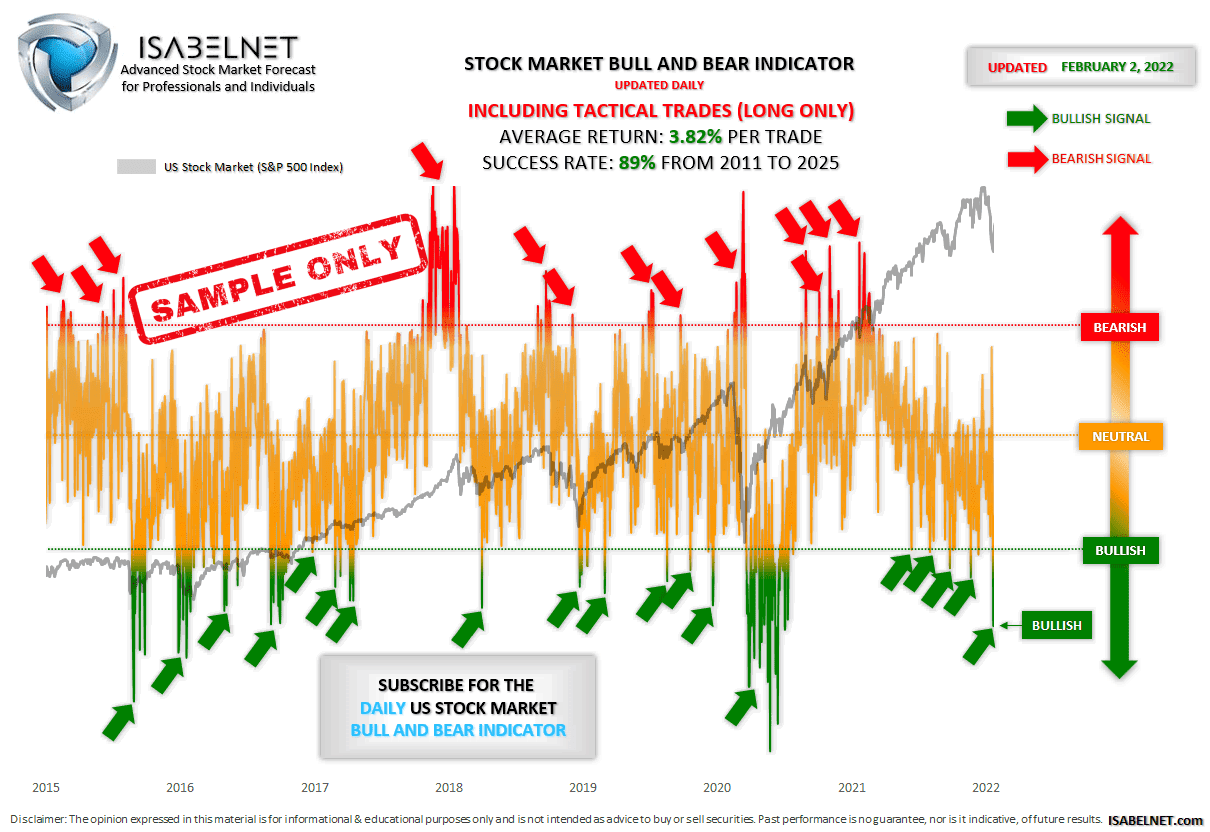
U.S. Stock Market Bull and Bear Indicator – S&P 500 Thursday, our Stock Market Bull & Bear Indicator was bullish well before the opening bell and the S&P 500 followed through, closing up 0.62%. Using multiple financial data, this great model helps investors navigate through different market conditions. It suggests whether the U.S. stock market…
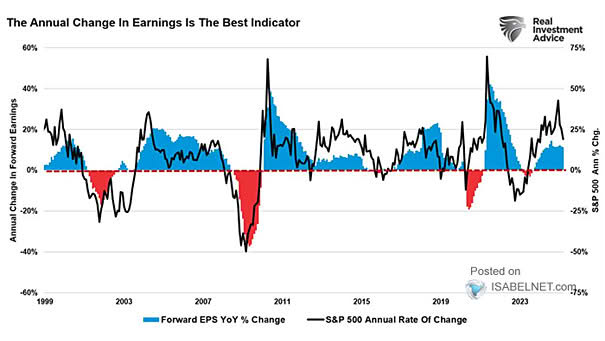
S&P 500 vs. Forward EPS
S&P 500 Annual Rate of Change vs. Annual Change in GAAP Earnings The S&P 500 tends to move in step with corporate earnings, so strategies built around steady profit growth make sense for investors looking to play the long game. In the end, earnings are what push stock prices higher. Image: Real Investment Advice
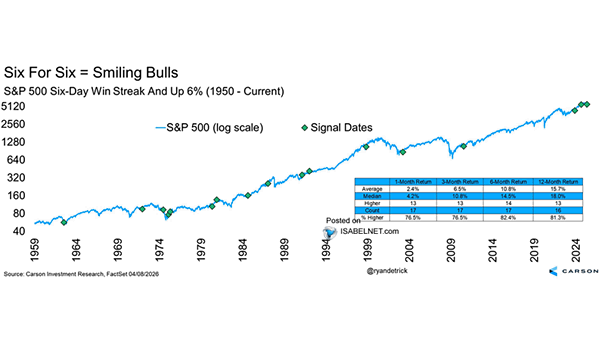
S&P 500 Performance After 6-Day Win Streaks and Up 6%
S&P 500 Performance After 6-Day Win Streaks and Up 6% Six days up in a row and a 6% surge: history says that combo often bodes well for U.S. stocks, with median 12-month gains of 18% since 1950, enough to keep the bulls smiling. Image: Carson Investment Research
"Your results are very interesting"
"Very impressive"

"I look forward to reviewing it"

"Your mathematical predictions were intriguing"

Lou Simpson
former Warren Buffett CIO
"Good stuff here everyone. Charts are very informative"

Jim Osman
CEO of the Edge & Forbes Contributor