S&P 500 Monthly Returns and Percentage of Time Up – Presidential Cycle Year 4

S&P 500 Monthly Returns and Percentage of Time Up – Presidential Cycle Year 4 Seasonality provides valuable insights into stock market trends. Historically, after experiencing weaknesses in September and October during election years, the S&P 500 tends to rebound with strong returns in November and December. Image: BofA Global Research

EPS Growth – Political Party and S&P 500 Profits Cycle

EPS Growth – Political Party and S&P 500 Profits Cycle While election results can impact markets in the short term, the underlying profitability of companies is a stronger driver of stock prices over time. Image: BofA US Equity & US Quant Strategy

S&P 500 3-Month Seasonal Returns and Presidential Cycle Year 4

S&P 500 3-Month Seasonal Returns and Presidential Cycle Year 4 June to August historically shines during election years, as it represents the strongest 3-month period in the fourth year of the presidential cycle, up 75% of the time with an average return of 7.27% since 1928. Image: BofA Global Research

S&P 500 Performance (May – October) Broken Down by Presidential Cycle

S&P 500 Performance (May – October) Broken Down by Presidential Cycle Sell in May and go away? Since 1950, the S&P 500 has shown an average return of 2.3% during the period from May through October in election years, making it an attractive period for investors. Image: Carson Investment Research

Distribution of S&P 500 12-Month Total Returns

Distribution of S&P 500 12-Month Total Returns Goldman Sachs, in its base case scenario, expects the S&P 500 index to generate a total return of 6% in 2024, which is slightly below the average return typically observed during presidential election years.

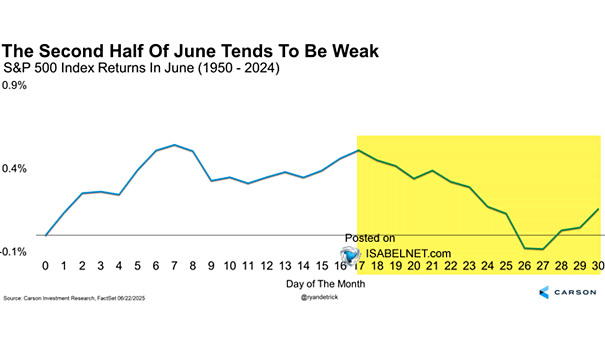
S&P 500 Performance in June

S&P 500 Performance in June In the past, when the S&P 500 has increased by more than 8% year-to-date heading into June in a pre-election year, positive outcomes have typically occurred in June. Image: Carson Investment Research

S&P 500 Performance November – April During Midterm Years

S&P 500 Performance November – April During Midterm Years Historically, the six months from November through April have seen the best performance for U.S. stocks following midterm elections. Image: Carson Investment Research

S&P 500 Index Monthly Performance in October

S&P 500 Index Monthly Performance in October In October, U.S. stocks tend to perform better in odd years than in even years, as odd years avoid elections and midterms. Image: LPL Research

Impact of U.S. Corporate Tax Hike on S&P 500

Impact of U.S. Corporate Tax Hike on S&P 500 This table suggests the impact on the S&P 500 if Joe Biden won the election and the Democrats swept both houses of Congress. Image: Societe Generale Cross Asset Research