EM/DM Relative Performance vs. U.S. Dollar

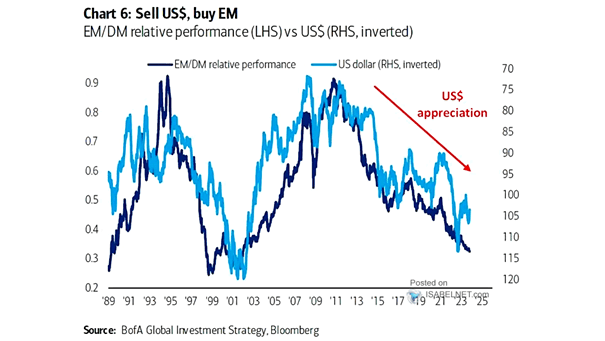
EM/DM Relative Performance vs. U.S. Dollar The strength of the U.S. dollar can affect the relative performance of EM/DM equities. A weak U.S. dollar has historically led to outperformance of emerging market equities. Image: BofA Global Investment Strategy
Distressed EM Bonds

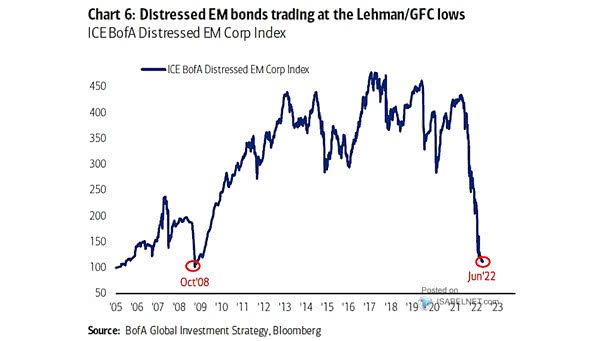
Distressed EM Bonds Distressed emerging market corporate bonds are trading at the Lehman/GFC lows. Image: BofA Global Investment Strategy

10-Year Government Real Bond Yield

10-Year Government Real Bond Yield Some emerging markets still have positive 10-year government real bond yields. Image: Alpine Macro

Performance – MSCI EM/S&P 500

Performance – MSCI EM/S&P 500 Why are emerging market equities underperforming the S&P 500 for so long? Image: The Daily Shot

EM vs. DM Valuation

EM vs. DM Valuation Emerging market equities look attractive relative to developed market equities. Image: Goldman Sachs Global Investment Research

The SARS Analog – Virus Outbreaks and Global Markets

The SARS Analog – Virus Outbreaks and Global Markets The chart shows the SARS analog (2002 vs. 2020), highlighting the S&P 500 Index, the MSCI China Index, emerging markets vs. U.S. EPS and the CRB Raw Industrials Index. Image: Fidelity Investments

World Economy – Industry as Share of Total GDP

World Economy – Industry as Share of Total GDP Industry represented 25% of the world’s GDP in 2018, and a larger percentage of GDP in emerging countries than in developed countries. Image: howmuch.net

China: Chinese Firms Reliance on USD-denominated Debt

China: Chinese Firms Reliance on USD-denominated Debt Chinese firms reliance on USD-denominated debt is lower than other emerging markets. But a weakened yuan would hurt Chinese firms. Image: Institute of International Finance